echnical Analysis 101 (18 Things You Should Know)
If you are a new forex trader and been searching for Technical Analysis
For Dummies or Technical Analysis Books or Technical Analysis Tutorial
so that you can learn technical analysis, then read this 18 things you
should know about technical analysis.
I’ve also linked to some amazing resources at the end which you can read for further study on technical analysis.
Lets get started… here’s first.
Table Of Contents [hide]
- #1: What Is Technical Analysis? Definition
- #2: What Is A Technical Analyst Is?
- #3: What Do Technical Analysts Believe In?
- #4: Do You Know What Is Price In Forex Technical Analysis Context?
- #5: What Is The Difference Between Technical Analysis Vs Fundamental Analysis?
- #6: What Tools Do Technical Analysts Use?
- #7: What Chart Patterns Do Technical Analysts Look For?
- 8: What Candlestick Patterns Do Technical Analysts Look For?
- #9: What Technical Analysis Indicators Are Used In Technical Analysis?
- #10: Who Is The “Father” Of Technical Analysis?
- #11: What Are The 3 Main Technical Analysis Theories Put Forward By Charles Dow Which Are Still Valid Today?
- #12: What Is The Price Discounts Everything Theory?
- #13: What Is The Price Movements Are Not Totally Random Theory?
- #14: What Is The “What Is More Important Than The Why“ Theory?
- #15: You Don’t Need A University Degree To Do Technical Analysis
- #16: Do You Need To Know Everything In Technical Analysis To Become A Profitable Trader?
- #16: Main Things Technical Analysts Look For In A Chart When Analyzing Price?
- 17: What Is The Core Of Technical Analysis?
- 18:What Is The Best Resource For Learning More About Technical Analysis (Especially Price Action)?
#1: What Is Technical Analysis? Definition
Technical analysis is a method for
forecasting of future direction of price movement based on the study of
past market data. This market data is mainly price at at times can be
volume as well.
#2: What Is A Technical Analyst Is?
Anyone who researches and analyzes the market based on past price data as well as technical indicators is a technical analysis.
Technical Analysts are also called technicians.
So if you learn about price action
trading, chart patterns, candlesticks, forex indicators and use them in
your trading later on, then you are a technical analysts.
Why?
Because you are basing your trading decisions (to buy or sell) on technical analysis you have done.
#3: What Do Technical Analysts Believe In?
There’s one important thing (pure) technical analysts believe in and this is it: that price movements are the result of supply and demand forces in the market for any given currency pair.
This belief system makes technical analysts completely opposites to fundamental analysts.
#4: Do You Know What Is Price In Forex Technical Analysis Context?
Price is simply the combination of open,
high, low or close of a currency pair over certain period of time.
This time can be 1 minute, 15 minutes, 30 minutes, 1 hour, 4 hour,
daily, weekly or monthly price data if you intend to use MT4 Trading
Platform.
Price over time is represented by charts. I will get to the topic of charts below.
#5: What Is The Difference Between Technical Analysis Vs Fundamental Analysis?
Here are the main differences between technical analysis and fundamental analysis…
Technical Analysis:
- technical analysis starts with a chart.
- technical analysts take a much shorter time horizon to do their technical analysis using time frames from a week, days, hours and even minutes.
Fundamental Analysis:
- fundamental analysis starts with a financial statement.
- fundamental analysts take a long relatively long term approach to analyzing the the forex market.
What is a financial statement? In the
context of forex fundamental analysis, financial statements (broadly
speaking) are such fundamental data like:
- interest rates,
- employment/unemployment rates,
- Gross Domestic Product,
- Trade Balance etc
There’s more to fundamental analysis
than those factors listed above. Other factors can include government
and political/geopolitical factors which are or can be really hard to
quantify by data.
So in forex, when a fundamental analysts
get busy analyzing fundamental data, what he is really doing is to
determine if a country’s economy is getting weaker (less demand for
their currency) or getting stronger (more demand for their currency).
For example:
- if a fundamental trader who wants to trade the Australia dollar, he would look the main factors that drive the Australian Economy.
- lets say that Australia’s unemployment rate last month was 5% and then this month its at 4% then what do you think is happening?
What do you think? Is the country’s economy in good shape or not?
Well the fact that the unemployment rate has decreased from 5% to 4%, that is a good indication that:
- a lot more people have entered the workforce,
- which means more businesses are active and are hiring employees
- which means more money in the pocket of the workers,
- which means they spend more on goods and services keeping business alive in the country,
- which means the governments gets more taxes from individuals as well as businesses.
So its good for the country? Yeah!
So what tends to happen is the the
Australian Dollar Will be a lot stronger than any currency pair that it
pairs up with, like AUDUSD.
This is a very basic explanation of how
fundamental analysts look at the underlying fundamental data to predict
or forecast the movement of price in the future and then trade based on
that information.
But you see, here’s the thing:
fundamental analysts will eventually have to get back to the use of
charts to time their trade entries.
On the other hand, technical analysts
believe that all that fundamental data is already factored into price by
the market forces of supply and demand therefore why bother stressing
about analyzing fundamental data when the price on the charts tell you
everything?
#6: What Tools Do Technical Analysts Use?
Technical analysts use many tools and techniques. The main one is the chart. A chart represents price behavior over time.
There are 3 main types of charts used and they are:
Now, I will take you briefly through each one of these 3 charts so you have a basic understand of the difference of each chart.
Candlestick Chart
The building block of a candlestick chart is a single candlestick:
When you have a group of candlesticks forming over a certain period of time then this forms a candlestick chart:

A candlestick chart simply looks like a candle, that’s why its called by that name…candlestick chart.
The information revealed in a candlestick chart are:
- the open price
- the high price
- the low price
- and the closing price
Additionally, the length of the “body”
of the candlestick gives you an idea of how far away the the price has
moved from the opening price before it closed and this tells you a lot
of things like:
- how strong the price move was during that period if the closing price is far away from the opening price.
- how weak the price move was if the closing price is closer to the opening price.
There a lot more to candlesticks than
just those two mentioned above. If I have to to write about
candlesticks, I won’t be able to write about what I’m writing here…which
is technical analysis.
In short, a candlestick chart is more
appealing to many traders and it is the most popular charting and tool
used the by traders.
Bar Chart
The building block of a bar chart is a single bar:
When you have lots of bars form across a certain time period then you have a bar chart:

A bar chart simplly looks like a bar, that’s why its called a “bar chart”.
The information shown in a bar chart is exactly the same as a candlestick chart:
- open price
- closing price
- high price
- low price

Bar chart is the 2nd most popular chart used in trading by technical analysts.
Line Chart
A line chart is a really simple chart that is just made of one line connecting either the open, high, low or close of prices. It is most often a line connecting the close of prices:
If you have a line connecting a serious of open, high or low or close of price over time, this gives you a line chart:

In reality, a line chart is would be rarely used in trading as it does not give you a much more fuller detail like the candlestick or the bar chart.
Comparing Candlestick Chart vs Bar Chart Vs Line Chart Side By Side
Let’s look at them side by side and see the difference, shall we?

Charts Summary
- candlestick charts are very popular, used by many traders
- bar char are also popular and used by traders
- line charts, rarely used for trading.
- technical analysts use candlestick charts and bar charts for their analysis (rarely line charts)
#7: What Chart Patterns Do Technical Analysts Look For?
There are many chart patterns but you
really don’t need a lot of them to make money in forex. You could just
learn a few and be good at it. What is the point of knowing everything
but being a master of none?
Knowing the different chart types is
good but not good enough. You need to know what to look for in a chart,
especially in a bar and candlestick chart.
So what are chart patterns? They are specific repeated price patterns that are formed as a result of price action on the charts.
These
chart patterns give traders an indication of the likely direction of
where price is going to go next. How do they know? Because of observing
and studying what happened in the past when these chart patterns were
formed.
So what kind of chart patterns do you have to look for?
In my price action trading course, there’s an entire chapter 10 dedicated to 9 profitable chart patterns, I suggest you head there and read it after going through this.
You will learn about such chart patterns like:
- the head and shoulders and the double bottom patterns and lots more. If you are a trader wanting to learn more about technical analysis head to that link on chart patterns.
8: What Candlestick Patterns Do Technical Analysts Look For?
Technicians also look for specific
candlestick patterns to give then an indication of the likely direction
price is going to move.
So what’s the difference between chart patterns and candlestick patterns?
Well, chart patterns usually involved a
lot more candlesticks compared a candlestick and these can be spaced
sporadically over time and it needs a keen eye to actually pick out the
charts patterns that are forming.
With candlestick patterns, at the most, it involves 1-2 candlesticks that form next to each other.
The best resource for you to learn more about candlestick patterns are these links below:
- top 10 reversal candlestick patterns
- if you want more details of each of the top 10 reversal candlesticks including how and why and why causes them to form, then click here.
#9: What Technical Analysis Indicators Are Used In Technical Analysis?
There are now hundreds of indicators that any forex trader can use today. But there are only a few that are much more frequently used that the rest.A quick look in the MT4 trading platform reveals this:
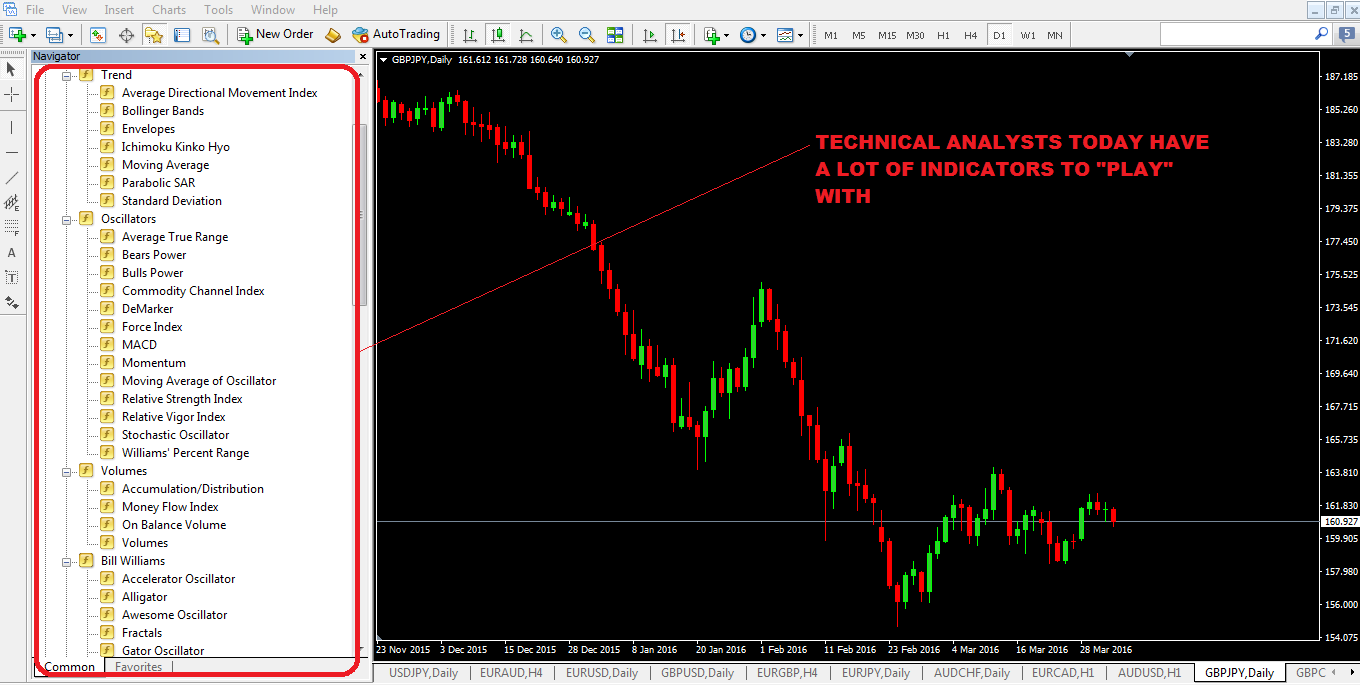
Most of these forex indicators are derived from price and to a lesser extent, volume.
Here are 4 Popular Technical Analysis Indicators For Trend Identification:
- moving average (for example, if moving average is pointing up and price is travelling above the moving average line then the trend is up, the opposite for downtrend)
- bollinger bands
- parabolic SAR.
- average directional movement index

Here are 5 examples of Popular Oscillator Indicators used by technical analysts:
- average true range
- commodity channel index
- MACD
- Relative Strength Index
- Stochastic Oscillator

All these indicator are tools used by technical analysts to assist them in making trading decisions.
#10: Who Is The “Father” Of Technical Analysis?
Charles Dow.Charles Dow was the guy credited with being the father of technical analysis.
#11: What Are The 3 Main Technical Analysis Theories Put Forward By Charles Dow Which Are Still Valid Today?
- price discounts everything
- price movements are not totally random
- “What” is more important then “Why?”
#12: What Is The Price Discounts Everything Theory?
I quote Stockcharts on this answer:Technical analysts believe that the current price fully reflects all information.Because all information is already reflected in the price, it represents the fair value, and should form the basis for analysis.After all, the market price reflects the sum knowledge of all participants, including traders, investors, portfolio managers, buy-side analysts, sell-side analysts, market strategist, technical analysts, fundamental analysts and many others.It would be folly to disagree with the price set by such an impressive array of people with impeccable credentials.Technical analysis utilizes the information captured by the price to interpret what the market is saying with the purpose of forming a view on the future.
#13: What Is The Price Movements Are Not Totally Random Theory?
I again quote stockcharts on this answer:Most technicians agree that prices trend. However, most technicians also acknowledge that there are periods when prices do not trend. If prices were always random, it would be extremely difficult to make money using technical analysis. In his book, Schwager on Futures: Technical Analysis, Jack Schwager states:
“One way of viewing it is that markets may witness extended periods of random fluctuation, interspersed with shorter periods of nonrandom behavior. The goal of the chartist is to identify those periods (i.e. major trends).”
#14: What Is The “What Is More Important Than The Why“ Theory?
Tony Plummer in his book, The Psychology of Technical Analysis, paraphrases Oscar Wilde by stating that “A technical analyst knows the price of everything, but the value of nothing”.
What do you think this means? Well, it means that technical analysts are only only interested in 2 things:
Price is the end result of the
underlying forces of supply and demand in a currency pair.Therefore by
focusing on one thing only…PRICE, technical analysis presents a direct
approach.
This argument does not sit well with fundamentalists because they are concerned with the ‘WHY’ price is what it is.
For a technical analyst, trying to ask
and then answer the “why” question brings a lot of possible answers and
some of those answers cannot be quantified and also on the same token,
they can be too broad.
So for a technical analysts perspective, it is best to concentrate on what and never mind the why and if the price goes up, the technical analysts knows that the answer is really one thing: more buyer (demand) than sellers (supply).
#15: You Don’t Need A University Degree To Do Technical Analysis
A chart is a chart! You don’t need a business or economics degree to know how to analyze a EURUSD chart or a GBPUSD chart or a AUDUSD chart.
But if you want to be a fundamental
analyst, getting a university degree in business economics can helps
because there’s a lot in fundamental analysis.
The good thing about technical analysis
that you in one financial market, example forex, can be applied to all
the markets-they are universal.
Things like support and resistance
levels, trading range, trend, price chart patterns, candlestick patterns
can be used on any chart. The time frame they are applied to does not
matter, it can be one minute up to on month.
#16: Do You Need To Know Everything In Technical Analysis To Become A Profitable Trader?
No. Being a very good technical analyst is no guarantee that you’d be a profitable trader, far from it. The application of technical analysis knowledge with sound forex money management leads to success.#16: Main Things Technical Analysts Look For In A Chart When Analyzing Price?
(1) Trends- When price is heading up, that is called an uptrend.
- when price is heading down, that is called a downtrend.
- the use of trend trading strategies like moving average crossovers like floor traders method or trendline trading system allows traders to ride trends to make profits in trending markets.

(2) Support levels
- A price level where price heads down and bounces up from significantly is a support level.
- spotting them on a chart is very easy, looke for “valleys” or bottoms
- support levels provide traders good buying opportunities
- the use of bullish reversal candlesticks for trade entries enhances your trading strategy in this situation.
- trading strategies like this can be really handy.

(3) Resistance Level
- resistance levels are opposites of support levels and by definition, resistance levels are price levels where price goes up, hits it and moves back down.
- spotting them on charts is really easy….look for a ‘mountain tops” or a peaks
- resistance levels provide very good selling opportunities
- the use of bearish reversal candlesticks to sell greatly enhances your trade entries.

(4) trading ranges or price channels
- price ranges can also be called channels and looks like a ball bouncing in a narrow tunnel until eventually price will breakout of of this narrow range either up or down.
- price channels are in fact support and resistance levels at work, so price bounces between the support and resistance levels.
- price channels can be horizontal like shown on the graph below, or they can be diagonal price channels.

17: What Is The Core Of Technical Analysis?
Price! That’s it.The objective of a technical analysis is to predict future price movements. Price is a leading indicator.
Why?
Because price often precedes fundamental developments and therefore it really makes sense to look directly at price movements.
18:What Is The Best Resource For Learning More About Technical Analysis (Especially Price Action)?
I’m going to be bias on this one BIG TIME…its my price action trading course, apart from being absolutely free and you don’t have to pay anything, my course covers topics such as:- price and charts in a lot more detail than what I’ve mention here
- an in depth look into candlesticks and understanding the buying and selling pressure on candlesticks
- what candlestick wicks tell you about the market forces of supply and demand
- an in depth look into forex market trends and this includes down theory of trends, structure of a bull market, structure of a bear market
- price reversals and continuation and 3 reasons why it is important for you to know them
- market swings
- how to trade support and resistance levels in much more in depth detail
- a lot more on 9 profitable chart patterns
- a lot more on 10 profitable candlestick patterns
- how to trade with fibonacci with price action
- how to trade trendlines with price action
- how to trade moving averages with price action
- how to trade confluence with price action
- multi timeframe analysis and trading techniques
What are the Best Technical Trading Indicators for Forex?
Download the short printable PDF version summarizing the key points of this lesson….Click Here to Download
Forex Technical Indicators
The technical analysis indicators, we will be discussing could be leading or lagging based on the time at which they provide a signal.Leading indicators are also called Oscillators. These are the Forex technical indicators which give you an entry/exit signal before the actual occurrence of the respective event.
Lagging indicators are typically Trend-Confirming Indicators. Lagging indicators give confirmation signals after the actual occurrence of the event. These are the trading indicators, which would give you a confirmation signal that the trend on the chart is underway.
Let’s now go through the best technical indicators for Forex Trading:
Leading Indicators (Oscillators)
Leading indicators are the indicators, which manage to give you a preliminary signal. This means, that a leading indicator could put you in the market in advance of the potential move, Keep in mind that even though leading indicators can get you into a trade at the beginning of a new leg, many times you can and will get false signals along the way.Therefore, traders often combine more than one leading indicators in order to eliminate as many fakeouts as possible. Let me now show you two of the most widely used leading technical indicators in Forex! These are the Stochastics indictor and the RSI indicator.
Learn What Works and What Doesn’t In the Forex
Markets….Join My Free Newsletter Packed with Actionable Tips and
Strategies To Get Your Trading Profitable…..Click Here to Join
Stochastic Indicator The Stochastics indictor was created by George Lane, and is one of the most popular indicators around. I, myself, had the pleasure of meeting George Lane back in the late 1990’s and spent about a week learning his trading methods. But that’s a story for another day. In essence, the stochastic indicator is used to determine overbought and oversold conditions in the market. In other words, the Stochastic can sometimes tell you that there is too much buying in the market and prices could be due for a correction. If the signal is oversold, then the Stochastic is telling you that maybe there are too many selloffs with this currency, and a possible rebound is due.
The Stochastics indicator consists of two lines which move together and interact with each other at some point. In addition the indicator has an upper and lower zone .The upper area is the overbought area and the lower area is the oversold area.
When the two lines enter the lower area, the Stochastic is giving us an oversold signal. In this case, we can buy the currency pair when the two lines cross upwards on their way out of the oversold area. If the two lines enter the upper area, the Stochastic is telling us that the Forex pair might be overbought. Then we can sell the pair when the two stochastic lines cross downwards on their way out of the overbought area. These are the two basic signals which the Stochastic Oscillator gives us.
However, the Stochastic is also very useful for divergence trading. If you do your technical analysis using the Stochastic, you will often notice that the indicator is moving upwards and the price is moving downwards, or the opposite. These are bullish and bearish divergences. If there is a bullish divergence between the price and the Stochastic, we can anticipate a possible price increase. The opposite is in force for bearish divergence. Now let’s take a closer look at the Stochastic Oscillator:

This is the H4 chart of the EUR/USD for the period Dec 16, 2015 – Jan 20, 2016. On the bottom of the chart you will see the Stochastic Oscillator.
- The first black arrow shows us the Stochastic in the oversold area. Stochastic breaks upwards and the price starts increasing.
- Then we have an overbought signal. A decrease comes right afterwards.
- A new oversold signal sets the beginning of a new bullish trend.
- The next overbought signal leads to the biggest decrease on this chart.
- On its way down the Stochastic gives us one false oversold signal.
- Then we get the real thing – an oversold signal which puts us in a big long position.
- The next signal is tiny and it hints for an overbought market. The price move is tiny too.
- Then we get a new overbought signal and we get a better downward move.
- On its way down the Stochastic gives us a false signal.
- Finally we get the last signal – oversold. We ge
No comments:
Post a Comment