https://www.youtube.com/watch?v=VP2m_T-gRLE Bangla excellent
How To Use Fibonacci And Fibonacci Extensions
Contents in this article [hide]
In this article, I will explain how to correctly draw a Fibonacci sequence and how to use the Fibonacci extensions for your trading.
How to draw Fibonaccis – just do it
Often, traders who have no prior experience with Fibonaccis are worried that they are ‘doing it wrong’ and they then don’t use the Fibonacci tool at all. I can assure you, there is no right or wrong when it comes to drawing Fibonacci and you will also see that different traders use Fibonacci in slightly different ways.The Fibonacci levels are %-based which means that even when you draw them differently, they will often line up correctly.
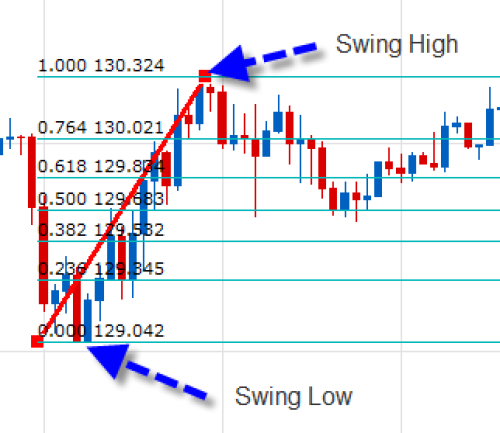
Step 1 – Find an ‘A to B’ move
To use the Fibonacci retracements, you have to first identify an ‘A to B’ move where you can use the Fibonacci retracement tool. What do we mean with ‘A to B’?A = the origin of a new price or trend move. These are usually swing highs and lows, or tops and bottoms.
B = Where the trend move pauses and reverses to make a retracement.
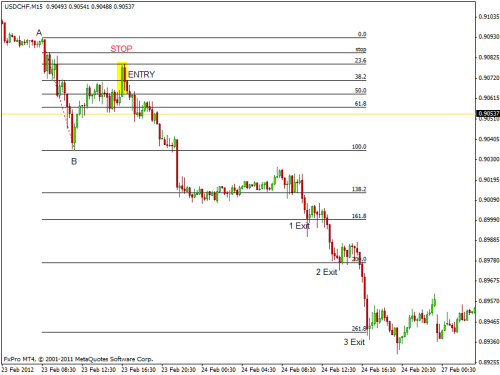
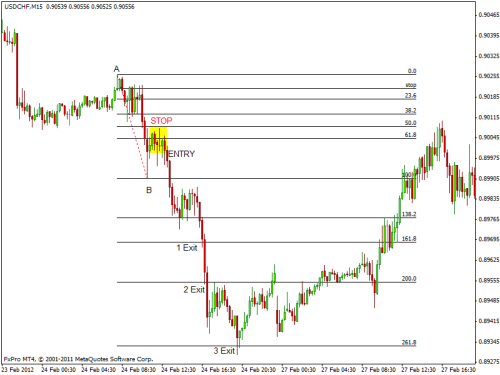
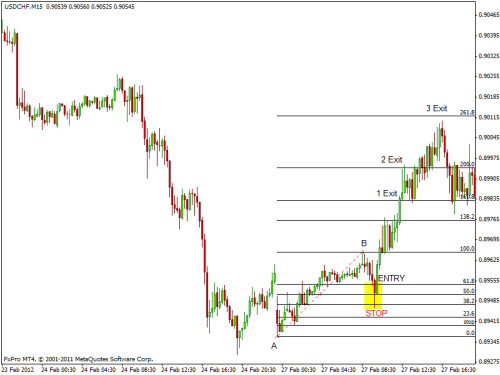
The following 4 screenshots show typical A to B moves
 |
 |
 |
 |
Connecting A to B moves with the Fibonacci retracement tool
 |
 |
 |
 |
Step 2 – Find the retracement point C
After you have identified an A to B move and plotted your Fibonacci tool on your charts, you should be able to find point C.C = the point where the retracement ends and price reverses into the original direction.
As you can see, the first 3 screenshots show the typical ABC move of a Fibonacci retracement. Point C is very obvious on all three charts and price bounced off the Fibonacci levels accurately.
Finding the C-Fibonacci retracement level
 |
 |
 |
 |
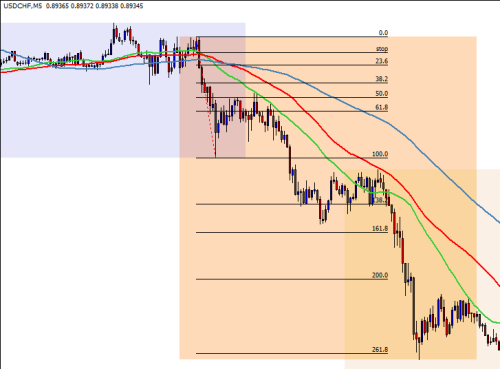
The fourth screenshot shows a scenario where price did not go back to the B-Fibonacci level, but breaks the prior A-Fibonacci. It’s important to understand that not all price moves will stop at a Fibonacci level. But, as you can see on the fourth screenshot, the Fibonacci tool can be used to identify support and resistance areas as well as we will explore in more detail shortly; the last screenshot shows nicely how price reacts to several different Fibonacci levels during the retracement.
Tip #1: Trial and error
Especially for beginners, the following exercise will help you build a strong foundation when it comes to drawing Fibonacci levels: Just grab the Fibonacci retracement tool and try to put it on different spots, while observing how price reacts to it. Usually, the more ‘snaps’ (price bouncing off a level) you see, the more important the Fibonacci retracement is.Tip #2: Don’t force a Fibonacci
Not every time you’ll be able to use a Fibonacci retracement to make sense of a price move. If you can’t make the Fibonacci levels snap, don’t try to force it. The best and most helpful Fibonacci retracements are those where you don’t have to look long.How to trade with Fibonacci
#1 Retracements as re-entries
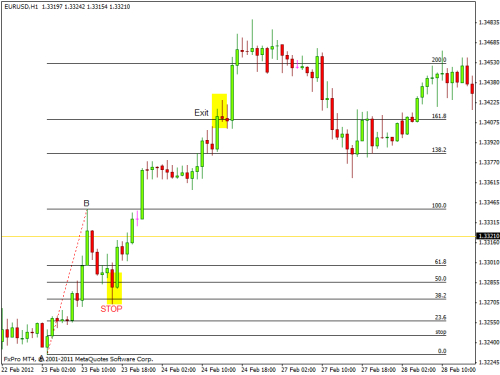
The most common use for Fibonacci levels is the regular retracement strategy. After identifying the ‘A to B’ move, you pay attention to the retracement level C.The screenshots below show a sudden bullish move in a larger uptrend. Often, traders miss such sudden outbursts and then try to find re-entries during pullbacks. The Fibonacci tool is ideal to identify swing-points during pullbacks as the sequence indicates. With the Fibonacci retracement tool, a trader would have been able to find 2 Fibonacci re-entries on the pullbacks.

#2 Support and resistance
Another possibility to use Fibonaccis is to find an AB-Fibonacci move on a higher timeframe and then go down to your regular timeframe and watch the retracement levels as support and resistance guidelines.The first screenshot below shows the Daily timeframe of the current EUR/USD chart. As you can see, there was a regular ‘A to B’ move. The screenshot in the bottom shows the same Fibonacci retracement but on the lower, 4 hour timeframe. As you can see, throughout the whole time, price reacted fairly accurately to the Fibonacci levels.
 |
 |
#3 Fibonacci levels for Take Profits – Fibonacci Extensions
Finally, you can also use Fibonaccis for your take profit orders. Especially the Fibonacci extensions are ideal to determine take profit levels in a trend. The most commonly used Fibonacci extension levels are 138.2 and 161.8.Most trading platforms allow you to add custom levels. Usually, the parameters to add the Fibonacci extensions are:
-0.618 for the 161.8 Fibonacci extension
-0.382 for the 138.2 Fibonacci extension
The rules for take profit orders are very individual, but most traders use it as follows:
A 50, 61.8 or 78.6 retracement will often go to the 161 Fibonacci extension after breaking through the 0%-level. A 38.2 retracement will often come to a halt at the 138 Fibonacci extension. The screenshots below show the Fibonacci moves from the beginning and this time we applied the extensions to the price moves. As you can see, the extensions provided great places for take profit orders.
In my strategy, I use the Fibonacci extensions to find trends that have completed an ABCD pattern and are likely to reverse. The Fib extension can be of great help here.
 |
|
 |
|
 click to enlarge click to enlarge |
Conclusion: Fibonaccis are multifunctional
The article demonstrated how to use Fibonaccis efficiently in your trading. However, don’t make the mistake of idealizing FIbonaccis and believing that they are superior over other tools and methods. Nevertheless, Fibonacci is a great tool to have and can be used very effectively as another confirmation method. Whether you are a trend following or a support and resistance trader, or just looking for ideas how to place your take profit orders, Fibonaccis are a great addition to your arsenal.Forex Trading Academy
Apply Here |
Fibonacci Retracements and Extensions
You may have already dismissed Fibonacci numbers, retracements, and extensions as the “magic numbers” of superstitious traders. Some Fibonacci traders would have you believe that Fibonacci numbers and levels can foretell future price action almost as if it were the mysterious universal numbers that markets gravitate around. The fact is, while Fibonacci numbers and levels may not be the secret sequences or ratios found in the nature of markets, it is a very popular method of looking at the markets, and like any indicator that is popular, its relevance rests with its self-fulfilling popularity. Many traders are buying and selling at Fib levels, and thus these levels work sometimes. This article will attempt to articulate the practical advantages of using Fibonacci levels as supplementary support and resistance levels, separating fact from fiction.The Fibonacci Story without the Fibbing
Fibonacci numbers, sequences and ratios are the result of work done by a famous Italian mathematician named Leonardo Pisano (his nickname was “Fibonacci”). He introduced the Fibonacci sequence in his book entitled Liber Abaci (1202), a book that introduced the Hindu-Arabic numerals used today to a Europe still using Roman numerals. The original problem in the Liber Abaci posed the question: How many pairs of rabbits can be generated from a single pair, if each month each mature pair brings forth a new pair, which from the second month, becomes productive.The end result is a series of numbers (the Fibonacci sequence) that when you add the previous two numbers you come up with the next number in the sequence: 1,2,3,5,8,13,21,34,55, 89, 144, etc. When you add 1 and 2 you get 3, and when you add 2 and 3, you get 5, and so on. Each number in the sequence is simply the sum of the two preceding terms and the sequence continues indefinitely. Once you have figured out how to generate the sequence, you can solve the rabbit problem by simply reading off the 12th number: 144 pairs.
As people solved the problem in Leonardo’s book, they began to notice that this frivolous sequence of numbers occurs frequently in nature, such as the number of petals in flowers, the spirals of flowers, and the spiral path of leaves on the tree. It seemed that whenever nature created a spiral the Fib sequence was one of the most efficient ways to do it.
Then, later, like any good detective novel, mathematicians began to make a connection between the Greek’s Golden Ratio ( ) (1.618) and the 13th century Fibonacci sequence. They took the Fibonacci sequence and divided each number into the one that follows it. Here is what you get: 1/1 = 1; 2/1 = 2; 3/2 = 1.5; 5/3 = 1.666 . . . ; 8/5 = 1.6; 13/8 = 1.625; 21/13 = 1.615 . . . ; 34/21 = 1.619 . . . ; 55/34 = 1.6176 . . . ; 89/55 = 1.6181 … When they saw the Greek’s Golden Ratio within the Fibonacci sequence, mathematicians became exited in the way only mathematicians can. They then searched for more connections, or more significant ratios.
Mathematicians began to explore, what if you divide each number by the one that follows it, and what if you divide by alternate numbers? They discovered that after the first few numbers in the sequence, the ratio of any number to the next higher number is approximately 0.618. For example, 34 divided by 55 equals .618. If you measure the ratio between alternate numbers you get .382. For example, 34 divided by 89 = 0.382. Yes, finding ratios was a simple matter of dividing the Fibonacci sequence from left to right, then from right to left, and dividing alternates in both directions. It was a mathematician’s game that eventually becomes a trader’s tool. Fib traders eventually agreed upon a number of significant ratios that they could use to grid the market up and down, in order to plot retracement levels and extension levels. Below are all the levels they eventually agreed upon.
Fibonacci Retracement Levels
0.236, 0.382, 0.500, 0.618, 0.764
Fibonacci Extension Levels
0, 0.382, 0.618, 1.000, 1.382, 1.618.
Some Fib traders give extra glamour to the above ratios, pointing out that they are the “Golden Ratios,” and they thus have been found in nature, science, architecture, music, and art. What they fail to point out is that only 1.618 represents the Golden Ratio first discussed by Pythagoras and Euclid (with the inverse of it, 0.618, first written about in the 16th century), while the others are simply interesting ratios found within the Fibonacci sequence itself, with some (like 0.500 and 1.00) not Fibonacci ratios at all. Moreover, this Golden Ratio, while it is found in some spirals of flowers and leaves in nature, it is by no means a universal law of nature, and while it has been flirted with by a few architects and artists in the past (with many false claims, such as Leonardo de Vinci’s use of it to proportion his Vitruvian Man or Sandro Botticelli’s use of it to proportion Venus in his famous painting The Birth of Venus), it is by no means a perfect proportion for a rectangle, pyramid, face or body, as some have assumed it to be.
Just as there is no magical or universal law to the Golden Ratio, so there is no magical or universal law within any of the Fibonacci ratios. They are simply interesting ratios discovered by mathematicians, and later adopted by traders. Traders have been allured by the seeming magic and gravity of the Fibonacci ratios in the markets, and because many do buy or sell on these levels, they become a self-fulfilling prophecy.
How do you plot these Fibonacci Retracement levels on a chart?
Well, you don’t really need to calculate all the above numbers manually. That would be too time consuming. You can have your charting software do the work for you. Or, better still, there are MT4 indicators that you can use to plot these levels.Using the Object Tool in MT4 (Tools/Fibonacci/Retracement)
In order to find these retracement levels using the Fibonacci object tool in MT4, you have to find the recent significant Swing Highs and Swing Lows of the chart and time frame in question.Note: In terms of time frame, it is probably best to keep with the higher time frames, such as H4 and Daily, as these give you a bigger picture of the action and where the best swing lows and swing highs are.
For an Uptrend: click on the Swing Low and drag the cursor to the most recent Swing High.
For a Downtrend: click on the Swing High and drag the cursor to the most recent Swing Low.
Definition of Swing Low and Swing High:
- A Swing High is a candlestick with the high of that bar being higher than the high of a certain number of bars before and after it.
- A Swing Low is a candlestick with the low of that bar being lower than the low of a certain number of bars before and after it.
Note: Swing high and swing low bars can be used to calculate trendlines, support and resistance lines, and pivot points, and even Fibonacci levels.
Let us look at a EUR/USD H4 chart of April 12:

You can see here H4 low (1.4020) on March 27 was the Swing Low, for it was lower than the low of the bars before and after it, and the HH4 high (1.4520) on April 12 was the Swing High, for it was higher than the high of the bars before and after it. When we calculate the range from swing point low to swing point high it is 500 pips. The object tool in MT4 automatically multiplied this range times the Fibonacci ratio: 38.2% (0.382), 50% (0.500), and 61.8% (061.8). It then subtracted these numbers from the swing point high, giving us the Fibonacci levels. Looking at the chart on the April 13 it looks as if the first Fibonacci level, at 23.6%, stopped the initial downward move, which suggests that the trend was so strong that it reversed on the shallowest of the support levels.
A useful MT4 indicator that calculates swing lows and highs automatically for you and plots the Fibonacci levels is: fibo swing (by John Lotoski). It plots swing highs and lows as a zigzag across the chart, and then plots the Fibonacci levels along the most recent swing high and low.
Using ForexRazor Fibonacci Retracement Calculator
Find the recent significant Swing Highs and Swing Lows of the chart and time frame in question.From the above examples on the EURUSD H4 chart, we have a swing low of 1.4020 and a swing high of 1.4520.Now go to the Forex Razor Fibonacci Retracement Calculator and plug those swing highs and lows into the calculator, for the uptrend:

Notice that this calculator plots the same Fibonacci retracement levels as the MT4 indicator. The advantage of our calculator over the MT4 indicator is that you don't need the MT4 account open and running to see at a glance what the levels are.
Fibonacci Retracement Levels for Bounce Trades
If you know the market is strongly trending, you can take advantage of Fibonacci levels for possible bounce trades that revert back in the direction of the major trend.Here are the different levels:
| Levels | Significance |
|---|---|
| 23.6% | The shallowest of the retracements. Good for taking bounce trades in very strong trending markets. |
| 38.2% | The second line of defense of the current trend, breaking this level starts to erode the underlying trend. |
| 50% | The neutral point of any retracement, it is the critical tipping point. |
| 61.8% | This is the level that has the biggest defense to rescue the main trend, and if it holds, the bounce can be huge. |
| 100% | This is the matching of the move. |
Entry Rule:
- For an Uptrend: you buy at a retracement of Fibonacci support level.
- For a DownTrend: you sell at a retracement of Fibonacci resistance level.
Uptrend Example
Let us have a look at what happened to EUR/USD H4 on April 19, after we plotted our Fibonacci levels (as above) on April 12:
Notice that while on the April 13th the first level (23.6%) seemed to stop the Bear's corrective move, and provided some bounce for the Bulls. If you had taken your profit near the Swing High, you would have pocketed 50 pips or so. However, eventually that first level was broken on the downside on April 18, and the break was powerful enough to carry it down through two additional levels (38.2% and 50%) until it finally poked its head through the last level (0.618), but could not quite manage a break of it. If you had taken up defenses at level 2 or level 3, you would badly beaten up in this downward move. The example above is a good reason why one should not put in limit orders at the levels themselves, without waiting for other reversal confirmations.
If you had waited patiently for the retracement down to the fourth level, the golden (0.618) level, the payoff would have been huge. On April 19, the H4 bar that had penetrated through the golden level ended up in the end to become a strongly bullish bar: it ended higher than its open and demonstrated a long lower shadow. A long lower shadow indicates that the Bears controlled the part of the bar, but lost control by the end and the Bulls made an impressive comeback. This would be the confirmation signal that the golden level held firm, and the bulls could then go on and stage an impressive counterattack. Eventually the Bulls regained their courage and shot the EUR/USD back up to the 0% level, the last Swing High in what seemed like a matter of hours. The above chart illustrates that the 0.618 level, the inverse golden ratio, is perhaps the strongest level of support for a bounce trade in the direction of a trend. Serious traders would have been patiently watching for a retracement back to that level to get into the Bullish game at a decent price.
If we use look at a chart on April 21, one day later, we can see that the EUR/USD continued past the former Swing High of 1.4520 in order to make a new Swing High at 1.4648. Instead of using the MT4 Fibonacci tool I will instead use the fibo_swing indicator to automatically plot the Fibonacci levels at the last two Swing Lows and Swing Highs:

You see how nicely the fibo_swing indicator automatically plots the Swing Low and Swing High, and then draws up the horizontal Fibonacci support levels. It instantly indicated that the first Fib level of 0.23 was at 1.4532, and sure enough, the market bounced from that point. Given the gravity defying 90% degree upward trajectory of the market, one could anticipate that the market is so strongly bullish that it must bounce off the first, and most shallow, of the Fibonacci support levels. It did not bounce up far, perhaps 50 pips or so, but that would have been enough pips for many who take up bounce trades at the first level. The market is still strongly bullish and there is no doubt that Bulls are taking up positions along different levels of the Fibonacci grid. There is no telling if the first level will hold or break, but if it eventually breaks, any of the lower levels would be a fair enough place to take a bounce trade.
Downtrend Example
USD/CHF has been a downtrend for many months and thus a good candidate for a Fibonacci scenario in a downtrend. Below is a H4 chart of USD/CHF on April 21. The same day that the EUR/USD had its big move up (above), the USD/CHF had its big move down.
I am using the cool fibo_swing indicator to automatically discover the Swing Highs and Swing Lows and plot the Fibonacci levels around them. In the above case, the indicator misnames Swing High and Swing Low (getting the names switched around), but nevertheless it finds the Swings, calculates the range, and grids the Fibonacci levels correctly from that range.
The expectation for a downtrend is that if price retraces its Swing Low, it will encounter resistance at one of the Fibonacci levels because traders will be ready and waiting to sell at these levels.
Notice how the first Fib level, at 0.23 (price: 0.8834) fails to provide a strong resistance to the USD/CHF correction, whereas that same level did provide support for the EUR/USD. Sometimes it is hard to know if those first levels will hold or break. Fib traders at the first levels usually put in smaller position sizes than at levels further away. Also, it is not a good idea to simply put a limit entry order in at these levels. It is also useful to gather confirmation signs that the level is holding. You want the candlesticks to demonstrate that the Bullish attackers are weakening. In the above case, the candlestick that breaks the initial level appears to be very bullish, indicated by its long white bar. At this point the corrective phase of the market has the power to break this first level and perhaps even the second level. If one were really wanting to get into this Bearish market trend, the most ideal place to take up a Bear bounce trade would be at the inverse golden ratio, 0.61 (price: 0.89231), if the market eventually gets back up there, and if long as one can see signs of weakening Bull candlesticks at this higher level.
Risk of Bounce Trades from Fibonacci Levels
You should always keep in mind that price won't always bounce from the Fibonacci levels. Sometimes they break, and if you are simply waiting there at each level, your account can be broken as well. Markets do not always trend in the same direction forever, for sometimes there is strong trend reversals like tsunami waves that can swallow up all the Fibonacci support and resistance levels, destroying all the defenders at these levels. You should be on guard against a potential reversal and put your stops in at all times to prevent your account from blowing up. Sometimes price may hit the 50% or the golden 61.8% and turn around, as expected, but sometimes the price will ignore these levels as if they never existed, breaking through them through them with extreme force.Setting Stops at Fibonacci Levels
Traders can use the Fibonacci levels to determine their stop loss.If the trader is buying at a Fibonacci support level, for instance, and the support level is violated, with the prices breaking down below that level, the reason for the trade is negated, and one should consider closing the position.
Your stop could be x pips below/above the level at which you are bouncing from, depending on how much breathing room you want to give the trade. You want to be able to get out when it is clearly seen that the level is broken, but you want to get out immediately (or when the level has been penetrated) just in case it turns out to be a false break.
Mitigating the Risk with Candlesticks:
When you are looking at a corrective phase in the market, and you want to take bounce positions at Fib levels, you will be looking for weakening candlesticks of the opposing team. If it is a downtrend and the Bulls are on the corrective counter attack, you want to see that the candlesticks forming at the Fib levels have lost much of their whiteness and are even showing long upper shadows, indicating that they are losing control of the battle for the bar, which at a Fib level would signify that the Bulls are losing control over the battle for the level.Finding Profit Levels via Fibonacci Extension (Expansion)
Once we find interesting levels in which to enter the market using Fibonacci retracement levels, the next question is: what kind of move is the market expected to make? Projecting the price move beyond the swing points is the answer every trader tries to seek.The Fibonacci Expansion tool can be found in MT4 (insert/Fibonacci/ Expansion).
You then drag the the tool from the recent Swing Low to the most recent Swing High. This time when you drag the extension tool across over these levels, you will see that market has been gridded above the Swing High, instead of being gridded in the range between the Swing Low and High.
You will get these levels: 0.618, 1.000, and 1.618, and they are used to set your take profit. After placing orders at the different Fib retracement levels, one can simply place a take profit at one of the above three extension levels. There is a high probability that traders will be looking at the 0.618 extension as the primary target to lock in profits. If the market is strongly trending, and momentum is very strong, traders can reset their take profit further out to the next level, 1.00, or even 1.618.
Earlier we showed you the retracement levels of the EURUSD that had been calculated from H4 Swing Low (1.4020) on March 27 to the H4 Swing High (1.4520) on April 12. In the following days it was shown that the market briefly bounced up from the first retracement level (23.6), but that the bears were in control till they found steadfast resistance at the golden level (61.8), at which the Bulls launched a massive counter-attack in resumption of the main trend. If one had been lucky enough to get in on this trade at this level, one would wonder where to put the take profit. Would it be at the last Swing High? But what if the last Swing High gives way, then where can one put a take profit?
Well, if one were to take the Fib extension tool and click on the same Swing Low (1.4020) on March 27 to the Swing High (1.4520) on April 12, one can see that the extended levels above the Swing High in which the market can move towards.

I did not re-plot the retracement levels on the above chart except for the 0.618 Retracement level, the one which the Bulls successfully bounced from, in order to avoid clutter. You can see that the extension tool used the same two Swing Points that generated the retracement levels as it did to generate the extension levels. The initial extension level of 61.8 (1.4595) turned out to be the best bet thus far for the Bulls to have taken profit. The market did make a brief high of 1.4648, but by that time it was a little too overextended, having traveled up too far, too fast.
Wrap Up: The Golden Mean
So far I have been uncritical of these Fibonacci retracement and extension levels, taking them for granted as levels which hold more weight and validity than random percent levels.If I were to don the skeptics hat, I would voice three counter-arguments to Fib levels:
1) Fibs ratios are interesting for Mathematicians but completely arbitrary for the markets.
When you strip away the Hollywood glamor of the Fibonacci ratios, separating fact from fiction, you get a number of ratios that are interesting to mathematicians and those wanting to count flower spirals, but outside that arena, you have traders in love with these ratios because of their ancient and "mysterious" pedigree to the golden ratio of 61.8. Even if we reject the ratios on a rational grounds, we are then told to embrace them on populist grounds: we must follow them because so many others following them. Is that he herd game we want to play?2) Multiplicity Creates Duplicity:
Because there are so many Fibonacci retracement levels, one of them is bound to work out. Put another way, you grid the chart with 4-5 levels, and you are bound to perceive that one of them has contained price action. You could have created your own arbitrary ratio of levels 4-5 deep, and put them down on the chart, and you may see that the price stops and reverses just as well at these levels.3) Interpretation Bias of Counting only Hits and Ignoring Misses
Once we become fascinated with Fibs, we tend to see all the times when they work, ignoring all the times when they don't work. Maybe we should be posting charts for every time fibs does not work. Maybe the best way of proving the "system" is to disprove that it actually works. We should be trying hard to look at the flaws of the system instead of where it succeeds.Answer to the Skeptics: Fibonacci levels work sometimes because of their self-fulfilling prophecy.
Sure, most of us our rational enough to know that they do not work because of their universal presence in nature or the markets. And yes, the initial reasons for why these levels were used by traders in the markets may be without much merit, but when more and more traders started buying and selling at these levels, these levels began to take on more significance than random ratios one can flip a coin upon.We do need to be aware of the fact that we are drawing many levels on the chart, one of which might stick. Fibonacci levels by themselves may not give much of an edge. But if there is a confluence between the Fibonacci levels and other support and resistance tools, such as trendlines, and SR lines derived from price action and pivot points, then that confluence can lend even greater weight to any one of the Fibonacci levels. Also, we must be on guard against the interpretation bias, and be ready to see the potential of any Fibs level going wrong as right, any level to break just as well as hold. That is why we are demanding additional confirmation from the candlesticks, and be willing to put in a reasonable stop loss if proved wrong.
In sum, it behooves us to follow the the path of the Greek's "golden mean" in relation to trusting in the Fibonacci levels: we must be very skeptical of their underlying significance and ability to hold at any given level, just as we must be willing to trust that these levels can be more powerful than any random level. It is hard to discount the fact that thousands of traders do plot and watch these levels, waiting for the price to retrace back to them before initiating bounce trades in the direction of the main trend, and if that is following the herd, we traders will do it if it can make us money.
How to Use Fibonacci Retracement to Enter a Trade
The first thing you should know about the Fibonacci tool is that it works best when the forex market is trending.
The idea is to go long (or buy) on a retracement at a Fibonacci support level when the market is trending up, and to go short (or sell) on a retracement at a Fibonacci resistance level when the market is trending down.
For uptrends, do the opposite. Click on the Swing Low and drag the cursor to the most recent Swing High.
Got that? Now, let’s take a look at some examples on how to apply Fibonacci retracements levels to the currency markets.

Here we plotted the Fibonacci retracement levels by clicking on the Swing Low at .6955 on April 20 and dragging the cursor to the Swing High at .8264 on June 3.
Tada! The software magically shows you the retracement levels.
As you can see from the chart, the Fibonacci retracement levels were .7955 (23.6%), .7764 (38.2%), .7609 (50.0%), .7454 (61.8%), and .7263 (76.4%).
Now, the expectation is that if AUD/USD retraces from the recent high, it will find support at one of those Fibonacci retracement levels because traders will be placing buy orders at these levels as price pulls back.
Now, let’s look at what happened after the Swing High occurred.

Price pulled back right through the 23.6% level and continued to shoot down over the next couple of weeks.
It even tested the 38.2% level but was unable to close below it. Later on, around July 14, the market resumed its upward move and eventually broke through the swing high.
Clearly, buying at the 38.2% Fibonacci level would have been a profitable long-term trade!

As you can see, we found our Swing High at 1.4195 on January 25 and our Swing Low at 1.3854 a few days later on February 1.
The retracement levels are 1.3933 (23.6%), 1.3983 (38.2%), 1.4023 (50.0%), 1.4064 (61.8%) and 1.4114 (76.4%).
The expectation for a downtrend is that if price retraces from this low, it could possibly encounter resistance at one of the Fibonacci levels because traders who want to play the downtrend at better prices may be ready with sell orders there.
Let’s take a look at what happened next.

Yowza, isn’t that a thing of beauty?!
The market did try to rally, stalled below the 38.2% level for a bit before testing the 50.0% level.
If you had some orders either at the 38.2% or 50.0% levels, you would’ve made some mad pips on that trade. In these two examples, we see that price found some temporary forex support or resistance at Fibonacci retracement levels.
Because of all the people who use the Fibonacci tool, those levels become self-fulfilling support and resistance levels.
One thing you should take note of is that price won’t always bounce from these levels. They should be looked at as areas of interest, or as Cyclopip likes to call them, “KILL ZONES!” We’ll teach you more about that later on.
For now, there’s something you should always remember about using the Fibonacci tool and it’s that they are not always simple to use!
If they were that simple, traders would always place their orders at Fibonacci retracement levels and the markets would trend forever.
In the next lesson, we’ll show you what can happen when Fibonacci retracement levels FAIL.
The theory of a golden ratio explains a set of natural forms and phenomena, and, therefore, is actively used for the forecasting of numerical ranks of any kind. In the financial markets Fibonacci Forex indicators are used for determining the most probable moments of retracement and the target levels, and highlighting these levels directly on a price chart. Accurate mathematical calculation formula enables Fibonacci's indicators on Forex to be independent of any asset type, the period of calculation and other market parameters.
How can Fibonacci be used in Forex? On the upward trend the lowest point should be chosen as the starting one and further we will move up to the point where the current trend is being corrected at the moment. On the downward trend we choose the most upper point (a start of motion down) and we move to an expected point of the beginning of correction.
Fibonacci can be used in Forex approximately in such a way:

Traditionally there can be made calculations of the following Fibonacci levels: 0; 23.6; 38.2; 50; 61.80; 78.6; 100; 161.8; 261.8; and 423.6, fr om which 50, 78.6, and 100 are not part of the classical sequence and therefore these price levels are regarded as weaker ones. Nevertheless, the level 50 is considered to be the most probable for the completion of the medium-term corrections, and levels 38.2, 61.8, 78.6 and 161.8 are usually recommended for an entry in the direction of the main trend.
For the Fibo lines to be drawn precisely there is a need for confident practical skills, namely an ability ‘to see’ the most significant price points on the graphics and to build trend lines correctly.
Usually Forex trading Fibonacci assumes that where the price reaches the target levels or an obvious retracement takes place, the constructed grid can just be ‘adjusted’ to new extremes. Fibo levels will not be redrawn when a timeframe changes. Therefore the good result is yielded by setting up several grids of the lines - from the large timeframe to the smaller one. Then it is possible to perform the possible intermediate corrections within a global trend more precisely. Coincidence of the Fibo levels constructed on the various periods makes such price level especially strong.
The trade methods stated below with the focus on the levels cannot be used as full Fibonacci Forex trade strategies, these are just trade schemes, reliability of which can be checked by the reader independently.


The second Forex Fibonacci strategy implies setting stop of initial price which is several points higher/ lower than max/min of initial price fluctuation.

If the price after all punches such extremum, then under Fibonacci trading Forex strategy the previous trend must have ended and it is really necessary to close a position.
Availability and simplicity of application of Fibonacci strategy trading by the great number of traders has led to the fact that the huge number of players starts thinking similarly and carrying out same the same drawings, and, therefore, Fibo levels really become the strong support/resistance as the large trade volumes are concentrated on them.
Therefore, a breakdown or kickback from Fibo levels usually causes operation of a huge number of the postponed orders, and consequently it amounts to the signal capable to affect a general tendency. Any Fibonacci Forex trading strategy for the market trade shall consider that in the zone close to Fibo levels speculative price bounces can possibly happen in case of a sharp breakdown. It is recommended to wait until these bounces stop and open new positions only after the market direction is determined.
Fibonacci price levels are not always accurately adjusted, and, therefore, the mere fact of achievement by the price of such value is not the basis for an entry at all. Any Fibonacci trading system shall be applied only along with other elements of the technical analysis.
lazarojr posted an article : 2 Mar.
In order to go into how you can make use of Fibonacci in your trading, you ought to know what exactly Fibonacci is all about.
Example in pair: USDCHF - 5 min
Example in pair: EURUSD - 60 min
 Some tips you must know:
Good trading...
Imagine the price of a Forex pair is trending upwards as a result of the bulls dominating over the bears. Then suddenly, the bears overtake the bulls and the price direction reverses. The price starts dropping against the previous trend, but for how long? This is where the Fibonacci ratios can be applied and prove useful in our trading decisions.
When the primary trend is finished and a contrary movement occurs, it is likely that the contrary move to equal 38.2% or 61.8% of the previous trend. The reason for this is that investors tend to change their attitude after the price retracements of 38.2% or 61.8% of the general trend. As we have already said, human nature has gotten used to the Fibonacci ratios within the natural environment and so it is just a natural tendency for traders, whom are part of the natural environment, to react at these levels. Traders are likely to switch sides when the price interacts with a crucial Fibonacci level.
Now that we have a basic understanding of the Fibonacci sequence and its effects in the financial markets, we turn our focus to the various trading tools that help us find these hidden levels on a chart

This is the 60 min chart of the most traded Forex pair – EUR/USD. The time frame is from– Jan 6 – 21, 2016. As you can see from the image above, we have marked the basic trend, by marking the bottom to the top of the trend. This is what we would use to calculate the Fibonacci retracement ratios. The horizontal lines mark the Fibonacci percentages based on the Fibonacci sequence.
Let’s see how the price reacts to the Fibonacci levels on this chart:

This is the Daily chart of the EUR/USD for the period May 30 – Nov 3, 2010. We have identified the basic trend, where we place our Fibonacci Fan instrument. The small black arrows show the areas where the price bounces from the Fibonacci Fan levels. The red circles show where the levels get broken.
Notice the way the price interacts with the trend lines of the fib fan:
In our case, we have no bounces from 38.2%. However, there are three bounces from 61.8%. Let’s simulate the eventual trading:
The idea is to go long (or buy) on a retracement at a Fibonacci support level when the market is trending up, and to go short (or sell) on a retracement at a Fibonacci resistance level when the market is trending down.
Finding Fibonacci Retracement Levels
In order to find these Fibonacci retracement levels, you have to find the recent significant Swing Highs and Swings Lows. Then, for downtrends, click on the Swing High and drag the cursor to the most recent Swing Low.For uptrends, do the opposite. Click on the Swing Low and drag the cursor to the most recent Swing High.
Got that? Now, let’s take a look at some examples on how to apply Fibonacci retracements levels to the currency markets.
Uptrend
This is a daily chart of AUD/USD.
Here we plotted the Fibonacci retracement levels by clicking on the Swing Low at .6955 on April 20 and dragging the cursor to the Swing High at .8264 on June 3.
Tada! The software magically shows you the retracement levels.
As you can see from the chart, the Fibonacci retracement levels were .7955 (23.6%), .7764 (38.2%), .7609 (50.0%), .7454 (61.8%), and .7263 (76.4%).
Now, the expectation is that if AUD/USD retraces from the recent high, it will find support at one of those Fibonacci retracement levels because traders will be placing buy orders at these levels as price pulls back.
Now, let’s look at what happened after the Swing High occurred.

Price pulled back right through the 23.6% level and continued to shoot down over the next couple of weeks.
It even tested the 38.2% level but was unable to close below it. Later on, around July 14, the market resumed its upward move and eventually broke through the swing high.
Clearly, buying at the 38.2% Fibonacci level would have been a profitable long-term trade!
Downtrend
Now, let’s see how we would use the Fibonacci retracement tool during a downtrend. Below is a 4-hour chart of EUR/USD.
As you can see, we found our Swing High at 1.4195 on January 25 and our Swing Low at 1.3854 a few days later on February 1.
The retracement levels are 1.3933 (23.6%), 1.3983 (38.2%), 1.4023 (50.0%), 1.4064 (61.8%) and 1.4114 (76.4%).
The expectation for a downtrend is that if price retraces from this low, it could possibly encounter resistance at one of the Fibonacci levels because traders who want to play the downtrend at better prices may be ready with sell orders there.
Let’s take a look at what happened next.

Yowza, isn’t that a thing of beauty?!
The market did try to rally, stalled below the 38.2% level for a bit before testing the 50.0% level.
If you had some orders either at the 38.2% or 50.0% levels, you would’ve made some mad pips on that trade. In these two examples, we see that price found some temporary forex support or resistance at Fibonacci retracement levels.
Because of all the people who use the Fibonacci tool, those levels become self-fulfilling support and resistance levels.
One thing you should take note of is that price won’t always bounce from these levels. They should be looked at as areas of interest, or as Cyclopip likes to call them, “KILL ZONES!” We’ll teach you more about that later on.
For now, there’s something you should always remember about using the Fibonacci tool and it’s that they are not always simple to use!
If they were that simple, traders would always place their orders at Fibonacci retracement levels and the markets would trend forever.
In the next lesson, we’ll show you what can happen when Fibonacci retracement levels FAIL.
Fibonacci Forex Strategy
Fibonacci Forex
strategy traditionally means that the first max/min is not the most
optimum point to start setting up Fibo grid. It is recommended to find
at least small double top or a double bottom in a zone where the current
trend begins, and it is necessary to construct Fibo levels from the
second key point.
Contents
- Fibonacci methods in Forex
- First correction Fibonacci system
- Parabola Hunt Fibonacci Strategy
- Continuation Gap Extension
- Overnight grid Fibonacci trading strategy
- Second High/Low Forex Fibonacci Scheme
- Overnight grid Fibonacci strategy
- Conclusion
The theory of a golden ratio explains a set of natural forms and phenomena, and, therefore, is actively used for the forecasting of numerical ranks of any kind. In the financial markets Fibonacci Forex indicators are used for determining the most probable moments of retracement and the target levels, and highlighting these levels directly on a price chart. Accurate mathematical calculation formula enables Fibonacci's indicators on Forex to be independent of any asset type, the period of calculation and other market parameters.
Fibonacci methods in Forex
Nowadays technical tools based on Fibonacci numbers are included in a standard set of any trade platform. Fibonacci lines, expansions, arches, a fan and temporary zones are commonly applied, but the first and the second indicators are the most widespread. The purpose of Fibonacci trading is to determine the depth of the possible correction, the retracement or continuation of a trend, price levels for setting up Fibonacci reasonable stop losses and for taking the optimum profit. Therefore, the correctness of setting Fibonacci lines plays a major role in the calculations. We will further remind the basic principles of drawing up Fibonacci lines.How can Fibonacci be used in Forex? On the upward trend the lowest point should be chosen as the starting one and further we will move up to the point where the current trend is being corrected at the moment. On the downward trend we choose the most upper point (a start of motion down) and we move to an expected point of the beginning of correction.
Fibonacci can be used in Forex approximately in such a way:
Traditionally there can be made calculations of the following Fibonacci levels: 0; 23.6; 38.2; 50; 61.80; 78.6; 100; 161.8; 261.8; and 423.6, fr om which 50, 78.6, and 100 are not part of the classical sequence and therefore these price levels are regarded as weaker ones. Nevertheless, the level 50 is considered to be the most probable for the completion of the medium-term corrections, and levels 38.2, 61.8, 78.6 and 161.8 are usually recommended for an entry in the direction of the main trend.
For the Fibo lines to be drawn precisely there is a need for confident practical skills, namely an ability ‘to see’ the most significant price points on the graphics and to build trend lines correctly.
Usually Forex trading Fibonacci assumes that where the price reaches the target levels or an obvious retracement takes place, the constructed grid can just be ‘adjusted’ to new extremes. Fibo levels will not be redrawn when a timeframe changes. Therefore the good result is yielded by setting up several grids of the lines - from the large timeframe to the smaller one. Then it is possible to perform the possible intermediate corrections within a global trend more precisely. Coincidence of the Fibo levels constructed on the various periods makes such price level especially strong.
The trade methods stated below with the focus on the levels cannot be used as full Fibonacci Forex trade strategies, these are just trade schemes, reliability of which can be checked by the reader independently.
First correction Fibonacci Forex trading system
The technique uses high probability of the first 100% recovery of the price after a previous strong trend that proves that there is a possible retracement after a new extremum and an emergence of a strong new tendency. Fibonacci strategy more often uses such signal on opening of transactions against an ‘old’ trend.Parabola Hunt Fibonacci Strategy
If there are no speculative bounces, then movement of the majority of assets in the lines interval 0%-38.2% and 61.8%-100% represents quite precise parabola. It gives the chance for opening of the breakdown transactions: after an exit from the range of 38.2%-61.8% the probability of the strong movement in a zone of the previous extremum is high.Continuation Gap Extension
If someone constructs Fibonacci grid so that the range of a gap ‘is located’ around 38.2%-61.8%, then the level of 100% will show a final point of movement in the case of the movement continuation in the direction of a price gap.Overnight grid Fibonacci trading strategy
This Forex Fibonacci system is applied only to volatile assets. Fibo grid is drawn up from max/min of the last trade hour of session till min/max of the first trade hour of the next day. The received levels are treated as strong indicators for intraday trade with small profits and close stops.Second High/Low Forex Fibonacci Scheme
Fibonacci Forex strategy traditionally means that the first max/min is not the most optimum point to start setting up Fibo grid. It is recommended to find at least small double top or a double bottom in a zone wh ere the current trend begins, and it is necessary to construct Fibo levels from the second key point. Accuracy of the levels constructed by such technique will be much higher.Stop Loss Fibonacci strategy
The first most popular Fibonacci Forex technique is the following: in case of an entry for the key level, we will put Stop Loss behind the next Fibo line. For example, if the entry is planned at the level of 38.2%, then we will put Stop Loss 2-5 points above/below than the level of 50% and further, if necessary, we move the stop order at the following Fibo levels.The second Forex Fibonacci strategy implies setting stop of initial price which is several points higher/ lower than max/min of initial price fluctuation.
If the price after all punches such extremum, then under Fibonacci trading Forex strategy the previous trend must have ended and it is really necessary to close a position.
Conclusion
Correctly established Fibo lines successfully replace drawing strong price levels, but there still exist some ‘underwater’ stones of Fibonacci Forex trading.Availability and simplicity of application of Fibonacci strategy trading by the great number of traders has led to the fact that the huge number of players starts thinking similarly and carrying out same the same drawings, and, therefore, Fibo levels really become the strong support/resistance as the large trade volumes are concentrated on them.
Therefore, a breakdown or kickback from Fibo levels usually causes operation of a huge number of the postponed orders, and consequently it amounts to the signal capable to affect a general tendency. Any Fibonacci Forex trading strategy for the market trade shall consider that in the zone close to Fibo levels speculative price bounces can possibly happen in case of a sharp breakdown. It is recommended to wait until these bounces stop and open new positions only after the market direction is determined.
Fibonacci price levels are not always accurately adjusted, and, therefore, the mere fact of achievement by the price of such value is not the basis for an entry at all. Any Fibonacci trading system shall be applied only along with other elements of the technical analysis.
Fibonacci Trading Strategy - Part 1
lazarojr posted an article : 2 Mar.
Introduction
Fibonacci
ratio is a golden ratio that you can find in nature all around us. It
is how tree divides its branches and how the mountain is formed and many
more. The most powerful ratio that is widely used in forex trading is
the 0.328, 0.5 and the 0.618 levels. Usually, you will find the price
respecting these levels by bouncing off them. It is not necessary for
you to know the mathematical formula behind the golden ratio as your
trading platform will definitely get it done for you without the need
for you to know the formula.
Fibonacci
Retracement is the collapsing of price when it hits a certain level. If
the price is moving in the Fibonacci patterns, you will find that it
will be supported by the 0.328, 0.5 or the 0.618 levels and this is
usually where you can take your trades waiting for reversal.
In order to go into how you can make use of Fibonacci in your trading, you ought to know what exactly Fibonacci is all about.
How to draw the Fibonacci level:
Most trading platform will be able to help you to draw the levels easily.
There are a lot of traders who are having problems with trading the Fibonacci as they do not always find the price respecting the levels. This is because those are not the Fibonacci setup and therefore do not display the patterns as discussed above.
- Place your cursor on a swing high
- Drag your cursor to a swing low
- Make SURE that the swing is at least 20 to 30 pips
- Select the levels you want to display and you are done.
Most trading platform will be able to help you to draw the levels easily.
There are a lot of traders who are having problems with trading the Fibonacci as they do not always find the price respecting the levels. This is because those are not the Fibonacci setup and therefore do not display the patterns as discussed above.
Trading setup:
Time frame: all (preferably 5min or 15min to doing day-trading).
Currency pairs: any.
Rules:
Step 1: Draw a Fibonacci retracement level
Step 2: Check if there is any support on the 0.328, 0.5 or 0.618 levels
Step 3:
If there is no support formed on any of these levels, it is not a
fibonacci pattern. Repeat step 1 until you can find one. If there is
support formed on any of the levels in step 2, you can then look for
opportunity to get into a trade
Step 4: then pick the extension level as your exit position, usually use 1.618 levels
Example in pair: USDCHF - 15 min
Example in pair: USDCHF - 5 min
Example in pair: EURUSD - 60 min
- Important fibonacci retracement levels: 0.618, 0.50 and 0.382
- Important Profit Targets levels: 1.618, 2.00 and 2.618
- Finonacci retracements show you low risk places to buy in the direction of the trend.
- Time frames to use Fibonacci are irrelevent. A swing as defined as a movement up or down can be seen on 1 min chart, 5 min, 60 min, etc. What you should do in using Fibonacci is make SURE that the swing is at least 20 to 30 pips. Fibonacci don't work well at all on small 10-15 pip moves.
- The 1.618 is a Fibonacci profit target to exit your trend trades at and consider counter trend IF there are other factors such as other support/resistance there and how far over extended the trend is.
- When a trader chooses to use small time frames (like 10 min, 15 min, 30 min even 1 hour) risks to be wrong are always higher than with larger time frames.
The above is how I use Fibonacci in my trading and hope that it can benefit you as well.
If you have ever read books about Warren Buffett, you are likely to be familiar with his two rules:
Rule #1: Never Lose Money
Rule #2: Never Forget Rule Number On
Fibonacci Trading – How To Use Fibonacci in Forex Trading
Fibonacci trading is becoming more popular, because traders have
learned that Forex and stock markets react to the Fibonacci numbers.
Fibonacci is the sequence of numbers discovered by Leonardo Fibonacci, an Italian mathematician: 0, 1, 2, 3, 5, 8, 13, 21, 34, 55, 89, 144, 233, 377, 610, 987, 1597, 2584, 4181, 6765, 10946, 17711, 28657, 46368, 75025, 121393 …….
Fibonacci numbers start from zero, and then 1 after that. The third number is calculated through adding 0+1 that are the first and the second numbers. The fourth number (3) is the second plus the third numbers (1+2). And so on…
Looks easy, right?
Now if you calculate the ratio of each number to the next one, you will have the Fibonacci Ratios that are the same numbers (levels) we use in our Forex or stock market technical analysis: 0.236, 0.382, 0.500, 0.618, 0.764 …….
To use these numbers in technical analysis you don’t have to make any calculations and you don’t even have to memorize them, because all trading platforms allow you to draw the Fibonacci levels and they have everything ready to use.
The only thing you should know is how to use the Fibonacci levels to analyze the price chart and find the next price destination.
Fibonacci trading means to know when and where market reverses or keeps on following the same direction. The most important thing in Fibonacci trading is that the Fibonacci levels act as support and resistance levels. When the price goes up, they act as resistance levels and visa versa. Also like regular support and resistance lines, when a Fibonacci level is broken as a resistance, it can act as a support and be retested. It is the same as when a Fibonacci level becomes broken as a support. It will act as a resistance then.
I think you have already seen the below painting by Leonardo Da Vinci (he is another Italian scientist and physician). If you draw Fibonacci levels on it (like what I did), you will see how Fibonacci numbers, specially the 0.618, work. They say 0.618 ratio can be seen in everything in our body in internal and external organs.

To use the Fibonacci numbers on the charts, you have to find the top and the bottom of the previous trend. When the previous trend is a downtrend, you draw the Fibonacci levels from top to bottom and extend the lines in the way that they cover the next completing and ongoing trend. When the previous trend is an uptrend, you draw the Fibonacci levels from bottom to top and extend the lines in the way that they cover the next completing trend.
You have to wait for the trend to become matured. You can not plot the Fibonacci levels while the trend is not matured. When you can not find a completed trend in a time frame, you have to look for one in a smaller or bigger time frame in the same currency pair or stock.
For example, on the below chart I plotted the Fibonacci levels from the beginning of an uptrend that was started on 16 Aug 2007 to the end of it that was on 23 Nov 2007. I plotted the levels from bottom to top.
Now let’s see how Fibonacci levels worked as support and resistance levels in the next trend. Please follow the red numbers on the below chart:
1. The price that started going down on 23 Nov 2007, touched the 23.60% level on 5 Dec 2007. This level worked as a support, and so the price went up as soon as it touched the level, but then went down to retest the 23.60% level.
As you know, usually when the price cannot break a support or resistance, it tries again and again and sometimes it can succeed to break out of the level.
2. So the price went up, but tried to test the 23.60% level eight days later on 14 Dec 2007 and succeeded to break below the 23.60% level this time, and then it went down.
3. The price tested the 38.20% level on 17 Dec 2007 and tried to break below it for five days, but failed and so started going up on 23 Dec 2007. It touched the 23.60% level when it was going up and it could break above it on 27 Dec 2007.
4. On 31 Dec 2007 it went down to retest the 23.60% as a support. On 2 Jan 2008 it failed and went up.
5. Currently (17 Jan 2008) it is retesting the 23.60% level once again as a support, and if this time it breaks the 23.60% level, it will go down. If not, it will go up, or sideways.


As you saw above, the price really reacts to the Fibonacci levels.
Why do Fibonacci levels have such a strong impact on the markets. Why does the price become stopped sometimes for several days below or above the Fibonacci levels?
Of course if you use the Fibonacci levels in the bigger time frames like weekly and monthly charts, you will see that sometimes the price becomes stopped by one of the Fibonacci levels for several weeks or months.
The answer of the above questions has no impact on our trading. I mean whether you know the reason or not, you can use Fibonacci levels in your trades. I know most of you don’t care about the answer, but some of you are eager to know.
Fibonacci numbers are used in the formation of humans body, from the genes (DNA molecule) to the internal and external organs. So they should be effective in their behaviors too.
Prices go up and down because of the behavior of traders: Buying and Selling >>> Bulls and Bears
Therefore, it is not surprising to see that markets react to Fibonacci levels.
So when the price is going up and you have already taken a long position (you have bought), you should be careful when the price becomes close to one of the Fibonacci levels. It is possible that it goes down and you lose the profit you have already made. So you have to move your stop loss to the open price of the first candlestick that is touching the Fibonacci level or a little higher. It depends on the length of the candlestick.
If you’ve made enough profit, you can close your position and wait for the price to break the Fibonacci levels or fail and go down. You can take a new position then.
It is the same as when the price is going down, but in this case Fibonacci levels act as support.
Also keep in mind that when one of the Fibonacci levels is broken, the price usually pullback to retest. If you get ready for all these possibilities, you will not be trapped.
You have to treat the Fibonacci levels as the real support and resistance levels. They really have no difference and sometimes the price reacts to them very strongly.
How can we know when traders decide to buy or sell? Fibonacci numbers are one of the tools that reflect what traders may have in their minds.
One of the most important problems of the traders is that they really don’t know where to plot the Fibonacci levels. They can not find the start and the stop points for plotting the Fibonacci levels. They choose the wrong points to plot the Fibonacci levels and this causes them to make mistakes.
A range, long or short, will be broken finally because the market cannot stay in an indecision situation forever. A range can be broken down or up, and this is what we want to know to take our positions and follow the markets.
If you are a Fibonacci trader, all you need is finding a range on one of the time frames and then finding the high and low of the range. Let me show you some examples.
Please follow the notes on the image below as you are reading these explanations. The below chart is the GBP/USD daily chart. GBP/USD started moving sideways almost from 2008.01.22. The distance between high and low of this range was over 1000 pips. It was still tradable but obviously the market was not trending. Almost on January 2008, we could not guess that we are at the beginning of ranging market, but when the price went down on 2008.02.20 and retested the same support line at 1.9329 and then started going up again, we learned that we had a strong support at 1.9329 that could be the low of a range. Then, when the price went up and made a high at 2.0392 on 2008.03.14, and then went down and retested the 1.9329 support for the third time on 2008.05.14, it assured the traders that a ranging market was formed. On a ranging market, chart patterns like triangle, wedge or even head and shoulders can form.
If the price breaks above the range, an uptrend will form, and visa versa. On the below chart, the price tested the 1.9329 support on 2008.05.14, it went up again but couldn’t reach the 2.0392 resistance and made a lower high at 2.0157 on 2008.07.15. When the price makes a lower high it means bulls (buyers) don’t have enough power to take the price up and make it reach the previous high it already reached. So, this can be considered as a signal that the range would be broken down. However, we should always wait for a real breakout:


Some of the Fibonacci numbers are more important for Forex traders. Indeed, 0.618, 61.80, 161.80 and 261.80 are the ones that work for us. 23.60 and 38.20 are also important but not as the 0.618 derivatives. I am going to show you some examples this week.
The 2015.02.18 candlestick on GBP/CAD daily chart formed a strong continuation signal above Bollinger Middle Band. Some traders are used to set pending orders above the high price of a candlestick like 2015.02.18 that has formed the setup. It makes sense to go long when the price breaks above the high price of the candlestick that has formed a long trade setup. But the question is where you should set the stop loss and target orders?
It is where you can use the Fibonacci Retracement Levels. Candlestick #1 on the below chart is the one that broke above the high price of 2015.02.18 candlestick. But as you see it was stopped by 161.80% level. A little below this levels is where you set your first target. You can close the first position here and then move the stop loss of the other positions to breakeven when the price reaches this level.
61.80% level is where you should set your stop loss. However, it is a little risky and usually markets retest/test this level. 38.20% level is a safer place for the stop loss. Of course, as I mentioned above, you can move the stop loss to breakeven when price reaches the 161.80% level. In the below examples, you would be out by candlestick #2.
I forgot to tell you how to plot the Fibonacci Levels based on the 2015.02.18 candlestick that has formed the trade setup. You should plot it from the candlestick’s high to low price, from top to bottom, so that the 161.80% and 261.80% levels be placed above. In case of short positions it will be the opposite.

Candlesticks 2014.10.12 and 2014.10.19 formed a too strong long trade setup on GBP/JPY weekly chart. GBP/JPY went up strongly for over 1670 pips:

Now let’s analyze the above movement using the Fibonacci Levels. I have plotted the Fibonacci Levels from the high to the low price of 2014.10.12 candlestick. Of course the long trade setup was reported when the next candlestick (2014.10.19) which is the confirmation candlestick closed. Based on the Fibonacci Levels, the stop loss had to be placed either where the 61.80% level is which is where we set the stop loss when we reported the trade setup on 2014.10.26 (see the above chart). GBP/JPY went up strongly and it didn’t retest the 61.80% level. It strongly broke above 161.80% and 261.80% levels (#1 and #2 on the below chart), but was stopped by 423.60% level (#3). Then it went as low as 161.80% to retest this level, but it works as a support and made the price bounce up (#4). Now it has broken above the 261.80% level again:

Next week can be an important week. AUD/JPY went all the way up to retest the broken support line. This week’s candlestick closed right below the line. Most probably next week’s candlestick will tell whether AUD/JPY will go down, or it will break above the line again and will go up:

Will AUD/JPY reach the 161.80% level?

GBP/CAD has formed a Bearish Engulfing Pattern by 2015.02.24 candlestick. It is a short trade setup, but not a too strong and 100 score one. There are some negative points with it:

2015.02.24 candlestick has formed a too strong Bearish Engulfing Pattern on the daily chart. Although the engulfing is too strong itself, but there is a weak Bollinger Upper Band breakout, and bulls still look strong. Therefore, this is a 90-95 score short trade setup.

USD/CAD is forming a Bollinger Bands Squeeze on the daily chart. It is just the beginning. It can become much longer than this, but it can be broken very soon too:

AUD/USD has been going down strongly during the past several months. It has formed a too strong downtrend. It has already formed a small Bollinger Bands Squeeze that was broken by yesterday’s candlestick. However, today’s candlestick has formed a too strong bearish body and so a too strong Bearish Engulfing Pattern:

Now the question is whether this is a too strong short trade setup or not?
It is a too strong Bearish Engulfing Pattern formed on a downtrend. So, it is a good continuation trade setup. The problem is it has already touched Bollinger Middle Band and it seems it is reacting to it as a support. I prefer not to take it. If it goes down after this candlestick, then I miss the movement. If it goes up, chances are it forms another too strong short trade setup with a better conditions.

We were right about the negative points of NZD/CAD short trade setup formed by 2015.02.24 daily candlestick. However, from today’s candlestick, you can say that it is possible that if forms another short trade setup soon. It is strongly possible that the next candlestick becomes bearish. You can say this from today’s candlestick upper shadow. Let’s see.
I will have to adjust the Fibonacci levels later.

Fibonacci is the sequence of numbers discovered by Leonardo Fibonacci, an Italian mathematician: 0, 1, 2, 3, 5, 8, 13, 21, 34, 55, 89, 144, 233, 377, 610, 987, 1597, 2584, 4181, 6765, 10946, 17711, 28657, 46368, 75025, 121393 …….
Fibonacci numbers start from zero, and then 1 after that. The third number is calculated through adding 0+1 that are the first and the second numbers. The fourth number (3) is the second plus the third numbers (1+2). And so on…
Looks easy, right?
Now if you calculate the ratio of each number to the next one, you will have the Fibonacci Ratios that are the same numbers (levels) we use in our Forex or stock market technical analysis: 0.236, 0.382, 0.500, 0.618, 0.764 …….
To use these numbers in technical analysis you don’t have to make any calculations and you don’t even have to memorize them, because all trading platforms allow you to draw the Fibonacci levels and they have everything ready to use.
The only thing you should know is how to use the Fibonacci levels to analyze the price chart and find the next price destination.
Fibonacci trading means to know when and where market reverses or keeps on following the same direction. The most important thing in Fibonacci trading is that the Fibonacci levels act as support and resistance levels. When the price goes up, they act as resistance levels and visa versa. Also like regular support and resistance lines, when a Fibonacci level is broken as a resistance, it can act as a support and be retested. It is the same as when a Fibonacci level becomes broken as a support. It will act as a resistance then.
Before you read the rest of this article... Submit your email to receive our eBook for Free:
Why the Price Reacts to the Fibonacci Levels on Different Markets?
The answer is “we don’t know”. The only thing we know is that Fibonacci numbers work in everything from the microscopic materials like DNA molecule to the distance between our eyes, ears, hands, even the distance of the planets in the solar system and the way they move in the space, even the distance and pathway of the stars in the universe, and finally in currencies’ prices and the way they move up and down. Fibonacci numbers can be found in everything in the world. Nobody knows why Fibonacci numbers have such a feature.I think you have already seen the below painting by Leonardo Da Vinci (he is another Italian scientist and physician). If you draw Fibonacci levels on it (like what I did), you will see how Fibonacci numbers, specially the 0.618, work. They say 0.618 ratio can be seen in everything in our body in internal and external organs.
How to Use the Fibonacci Numbers in Forex Trading?
Fibonacci trading is not complicated. By using the Fibonacci numbers on the charts, you can find more supports and resistances. It will be a big help to choose the right direction and avoid taking the wrong positions. They are also so helpful in setting the stop loss and target orders.To use the Fibonacci numbers on the charts, you have to find the top and the bottom of the previous trend. When the previous trend is a downtrend, you draw the Fibonacci levels from top to bottom and extend the lines in the way that they cover the next completing and ongoing trend. When the previous trend is an uptrend, you draw the Fibonacci levels from bottom to top and extend the lines in the way that they cover the next completing trend.
You have to wait for the trend to become matured. You can not plot the Fibonacci levels while the trend is not matured. When you can not find a completed trend in a time frame, you have to look for one in a smaller or bigger time frame in the same currency pair or stock.
For example, on the below chart I plotted the Fibonacci levels from the beginning of an uptrend that was started on 16 Aug 2007 to the end of it that was on 23 Nov 2007. I plotted the levels from bottom to top.
Now let’s see how Fibonacci levels worked as support and resistance levels in the next trend. Please follow the red numbers on the below chart:
1. The price that started going down on 23 Nov 2007, touched the 23.60% level on 5 Dec 2007. This level worked as a support, and so the price went up as soon as it touched the level, but then went down to retest the 23.60% level.
As you know, usually when the price cannot break a support or resistance, it tries again and again and sometimes it can succeed to break out of the level.
2. So the price went up, but tried to test the 23.60% level eight days later on 14 Dec 2007 and succeeded to break below the 23.60% level this time, and then it went down.
3. The price tested the 38.20% level on 17 Dec 2007 and tried to break below it for five days, but failed and so started going up on 23 Dec 2007. It touched the 23.60% level when it was going up and it could break above it on 27 Dec 2007.
4. On 31 Dec 2007 it went down to retest the 23.60% as a support. On 2 Jan 2008 it failed and went up.
5. Currently (17 Jan 2008) it is retesting the 23.60% level once again as a support, and if this time it breaks the 23.60% level, it will go down. If not, it will go up, or sideways.
Let’s look at another example. Please follow the red numbers on the below chart:
A big downtrend on the GBP/JPY daily chart started on 22
July 2007 and ended on 17 Aug 2007. So I plotted the Fibonacci levels
from the top to the bottom (from 22 July 2007 to 17 Aug 2007).
1. While going up, the price tested the 23.60% level on
20 Aug 2007 and broke above it easily, but on the next day it went down
to retest the 23.60% level as a support. It could not break below, and
so the price went up.
2. The price didn’t show any reaction to the 38.20%
level as a resistance and went up, but was stopped by the 50% level on
26 Aug 2007. From 26 Aug to 1 Oct 2007, price went up and down between
the 23.60% and 50% levels. During this period of time, the 38.20% level
worked as support and resistance several times and it seems that the
price was rotating around the 38.20% level. It made a consolidation
around the 38.20% level.
3. The 50% level was broken finally on 1 Oct 2007 and the price went up.
4. It had a hard time in breaking the 61.80% level. It
tried for ten days from 5 to 16 Oct 2007 to break the 61.80% level, but
failed and bounced down.
5. While going down, it passed through the 50% level
without any problems, but it was stopped by the 38.20% level that acted
as support on 22 Oct 2007. It went up on 23 Oct, tested the 50% level,
went down on 24 Oct and then tested the 50% on 29 Oct and broke above
it.
6. On 31 Oct 2007, it reached the 61.80% once again and
tried for several days but failed again, went down and made a double
top. The price went much lower after it failed to break above the 61.80%
level.
7. On 9 Nov 2007 it broke below the 38.20% level and
made a consolidation around the 23.60% level. Like the 61.80% level, the
23.60% level acted as support and resistance several times and a
consolidation was formed around it.
As you know, consolidations including, triangles,
wedges, pennants and channels are continuation patterns. It means the
price usually follows the same direction that it was following before
the consolidation forms.
8. Finally it went down and broke below the 0.00% level on 2 Jan 2008.
As you saw above, the price really reacts to the Fibonacci levels.
Why do Fibonacci levels have such a strong impact on the markets. Why does the price become stopped sometimes for several days below or above the Fibonacci levels?
Of course if you use the Fibonacci levels in the bigger time frames like weekly and monthly charts, you will see that sometimes the price becomes stopped by one of the Fibonacci levels for several weeks or months.
The answer of the above questions has no impact on our trading. I mean whether you know the reason or not, you can use Fibonacci levels in your trades. I know most of you don’t care about the answer, but some of you are eager to know.
Fibonacci numbers are used in the formation of humans body, from the genes (DNA molecule) to the internal and external organs. So they should be effective in their behaviors too.
Prices go up and down because of the behavior of traders: Buying and Selling >>> Bulls and Bears
Therefore, it is not surprising to see that markets react to Fibonacci levels.
What Time Frame Is Better for Using the Fibonacci Levels?
It depends on your trading system. You can use Fibonacci levels in all time frames. When you use them on the bigger time frames like daily, the result will be applicable for the next several days, weeks and even months and when you use them on smaller time frames like 5 minutes, the result can be applicable only for few hours because the price will leave the Fibonacci levels area very soon (it is not recommended to trade the shorter time frames, because they are not that stable and reliable and you will make a lot of mistakes because you don’t have enough time when trading the shorter time frames.)You Plotted the Fibonacci Levels on Your Chart. What Next?
Fibonacci trading is using the Fibonacci levels as support and resistance levels and taking proper positions based on them. As I already explained, Fibonacci levels act as support and resistance levels.So when the price is going up and you have already taken a long position (you have bought), you should be careful when the price becomes close to one of the Fibonacci levels. It is possible that it goes down and you lose the profit you have already made. So you have to move your stop loss to the open price of the first candlestick that is touching the Fibonacci level or a little higher. It depends on the length of the candlestick.
If you’ve made enough profit, you can close your position and wait for the price to break the Fibonacci levels or fail and go down. You can take a new position then.
It is the same as when the price is going down, but in this case Fibonacci levels act as support.
Also keep in mind that when one of the Fibonacci levels is broken, the price usually pullback to retest. If you get ready for all these possibilities, you will not be trapped.
You have to treat the Fibonacci levels as the real support and resistance levels. They really have no difference and sometimes the price reacts to them very strongly.
More About Using Fibonacci in Forex Trading
Fibonacci numbers really work in forex trading because they reflect the psychology of the traders. Trading forex or stocks is all about knowing the psychology of the traders: When most traders sell, the price goes down and when they buy, the price goes up.How can we know when traders decide to buy or sell? Fibonacci numbers are one of the tools that reflect what traders may have in their minds.
One of the most important problems of the traders is that they really don’t know where to plot the Fibonacci levels. They can not find the start and the stop points for plotting the Fibonacci levels. They choose the wrong points to plot the Fibonacci levels and this causes them to make mistakes.
1. Ranging or Sideways Markets
One of the best places to plot the Fibonacci levels, is the resistance and support of the ranging markets. When the market is slow and in fact is in an indecision situation that means the traders are waiting for each others’ action and nobody wants to take risks before the others, the price fluctuation will become very small and the price goes up and down inside a range. We can see the ranging or sideways markets on all different time frames.A range, long or short, will be broken finally because the market cannot stay in an indecision situation forever. A range can be broken down or up, and this is what we want to know to take our positions and follow the markets.
If you are a Fibonacci trader, all you need is finding a range on one of the time frames and then finding the high and low of the range. Let me show you some examples.
Please follow the notes on the image below as you are reading these explanations. The below chart is the GBP/USD daily chart. GBP/USD started moving sideways almost from 2008.01.22. The distance between high and low of this range was over 1000 pips. It was still tradable but obviously the market was not trending. Almost on January 2008, we could not guess that we are at the beginning of ranging market, but when the price went down on 2008.02.20 and retested the same support line at 1.9329 and then started going up again, we learned that we had a strong support at 1.9329 that could be the low of a range. Then, when the price went up and made a high at 2.0392 on 2008.03.14, and then went down and retested the 1.9329 support for the third time on 2008.05.14, it assured the traders that a ranging market was formed. On a ranging market, chart patterns like triangle, wedge or even head and shoulders can form.
If the price breaks above the range, an uptrend will form, and visa versa. On the below chart, the price tested the 1.9329 support on 2008.05.14, it went up again but couldn’t reach the 2.0392 resistance and made a lower high at 2.0157 on 2008.07.15. When the price makes a lower high it means bulls (buyers) don’t have enough power to take the price up and make it reach the previous high it already reached. So, this can be considered as a signal that the range would be broken down. However, we should always wait for a real breakout:
Almost all of the signs (higher lows) tell us that the
range should be broken down. We have to wait until the breakout occurs.
We don’t have to guess or predict anything. When the support of the
range is broken, we can go short and when the resistance is broken, we
can go long.
The signals indicated that the price would break below
the range. Therefore, I plotted the Fibonacci levels from the low of the
range to the top. So, the 0.0 level was placed at the high of the range
and the 100.0 level was placed at the low. Also, all other 161.80,
261.80 and 423.60 levels were placed below the range. These numbers are
called the Fibonacci Extensions:
If the price had broken above the range, then we would
have to plot the Fibonacci levels from top of the range to the bottom,
and so the 161.80, 261.80 and 423.60 levels would be placed above the
range.
Now let’s zoom out and analyze the chart in more details. Please follow the below chart.
The 2008.08.08 candlestick tells us that the price has
broken below the range because it is closed below the range support. We
could go short at the close of this candlestick if we were not already
short after the formation of the 2008.07.15 lower high. Our target would
be the 161.80 level. The stop loss has to be placed above the open of
this candlestick.
When the price breakouts out of a range, the 161.80
level is the guaranteed target level that in 95% of the cases will be
reached by the price. If the breakout is strong enough, the 261.80 and
even the 423.60 will be reached too. Among the Fibonacci retracement
levels or the levels that are placed between zero and 100, the 23.60 and
38.20 are the most important ones and as you can see the 2008.07.15
lower high is formed exactly below the 23.60 level. Before this lower
high, we have a smaller lower high which is formed below the 38.20 level
(the red arrow). Do you see how exactly and precisely the Fibonacci
levels work?
So we could go short at the close of 2008.08.08 candlestick and your target could be the 161.80 level.
Let’s take a look at the next part of the chart. As you
see (the below image) when the price reached the 261.60, it went up to
retest the 161.80 level (follow the numbers – #1). It is time to
emphasize on the importance of 161.80 level. This level works as a very
strong support/resistance. When breaks below or above this level, it
usually retest the level in 95% of the cases. On the below chart, the
price goes up and retests the 161.80 level (#2) and then goes down.
You could go short again here, set the target at 261.80 and the stop
loss above the 161.80 levels.
Again when the price broke down the 261.80, it went up
and retested this level, but the 2008.10.20 candle indicated that it
would keep on going down again. Why the 2008.10.20 candle? Because it is
a bearish candlestick that closed below the low and the close of the
last 5 candles. It also has covered the whole bodies and shadows of the
last three candles and have formed a bearish pattern which is called
Dark Cloud Cover.
This downtrend could be traded differently as well.
You could wait for the price to break below the range support. Then you
had to wait for the price to start going up and make the first
correction, flag or consolidation. Then when it started following the
downtrend to go down once again, you could go short. Take a look at the
below image and you will know what I mean. I am now talking about the
Elliott Waves. What I am trying to say is trading the second Elliott
Wave which is the best one.
2. Trading the Second Wave after the Range Breakout
Please follow the numbers on the below chart. The below chart is the same chart above but with a different way of trading.
In many cases, a trend will be started when a range
becomes broken (As you saw above). As I said ranging means indecision.
When we have a ranging market, it means traders are waiting for each
other to take the risk. They want the price to start moving and then
take the proper position. They don’t want to take any risk before the
others. When the market breaks out of the range (#1 in the below image),
the traders who have been waiting for the market to move and break the
range, follow the newly started trend and take the proper position
(short position in this case) and this will provide more fuel for the
price to follow the breakout direction (to go down in this case).
Then after a while that the market keeps on moving, some
traders decide to close their positions and collect their profit, and
so the price starts moving to the other direction (#2 in the above
image). But there are also a lot of other traders who keep their
positions and wait for the price to start moving to the direction of the
breakout again. These traders will add to their positions, and at the
same time, some other traders who are late, will come and see the trend
and take the proper position. So the price starts moving to the
direction of the trend again (#3 in the above image). This is where most
traders take their positions, because they believe that the trend is
confirmed only when the price starts following the breakout direction
once again.
When the price starts following the breakout direction,
it is the beginning of the second Elliott Wave which has the biggest
movement and is the best to trade. Some professional traders only trade
the second wave. At the above image, the second wave is started at #3
and is finished at #8.
Learn more about the Elliott Waves: Elliott Wave Analysis For Beginners
Fibonacci levels are the best tools to show us the waves and our entry and exit points:
1. Wait for the range breakout (#1).
2. Wait for the price to start moving against the breakout (#2).
3. Wait for the price to start following the breakout direction again (#3) and take the proper position (short position in this case) and set the target to the first low support line (#4) and set the stop above the 0.0 level.
4. Wait for the price to break below the first low support line (#4).
5. If it doesn’t do that, then close your position and wait for the price to follow the trend direction again.
6. If it breaks below the first low support line (#4), but goes up to retest the broken support (#5), then close your position and wait for the price to follow the trend direction again.
7. If it doesn’t break above the broken support and starts following the trend direction again (#5 and #6), then take the proper position again (short position in this case) and set the 161.80 level as the target.
8. If it breaks below the 161.80 level (#7), then hold your position, or if you have already closed it, take it again and set the target to 261.80 level (#8).
9. Wait for the price to retest the 161.80 (#9) and when it fails to break the 161.80 and starts following the trend direction again, take the position (short position in this case) and set the target to 261.80 again.
10. It is possible that it breaks the 261.80 level but retests it (#11, #12 and #13). If you see the trend is strong enough to move toward the 423.60 level, take the proper position (short position in this case) and set the target to 423.60 and place the stop loss above the 261.80 level.
Your main profit could be made by trading the second
wave (#3 to #8), and some traders do not take any position after that
because in most cases the market becomes choppy after the second wave.
Fibonacci Retracement Levels and Daily Candlesticks
Markets really react to the Fibonacci levels, no matter what time frame or currency market it is.Some of the Fibonacci numbers are more important for Forex traders. Indeed, 0.618, 61.80, 161.80 and 261.80 are the ones that work for us. 23.60 and 38.20 are also important but not as the 0.618 derivatives. I am going to show you some examples this week.
The 2015.02.18 candlestick on GBP/CAD daily chart formed a strong continuation signal above Bollinger Middle Band. Some traders are used to set pending orders above the high price of a candlestick like 2015.02.18 that has formed the setup. It makes sense to go long when the price breaks above the high price of the candlestick that has formed a long trade setup. But the question is where you should set the stop loss and target orders?
It is where you can use the Fibonacci Retracement Levels. Candlestick #1 on the below chart is the one that broke above the high price of 2015.02.18 candlestick. But as you see it was stopped by 161.80% level. A little below this levels is where you set your first target. You can close the first position here and then move the stop loss of the other positions to breakeven when the price reaches this level.
61.80% level is where you should set your stop loss. However, it is a little risky and usually markets retest/test this level. 38.20% level is a safer place for the stop loss. Of course, as I mentioned above, you can move the stop loss to breakeven when price reaches the 161.80% level. In the below examples, you would be out by candlestick #2.
I forgot to tell you how to plot the Fibonacci Levels based on the 2015.02.18 candlestick that has formed the trade setup. You should plot it from the candlestick’s high to low price, from top to bottom, so that the 161.80% and 261.80% levels be placed above. In case of short positions it will be the opposite.

Candlesticks 2014.10.12 and 2014.10.19 formed a too strong long trade setup on GBP/JPY weekly chart. GBP/JPY went up strongly for over 1670 pips:

Now let’s analyze the above movement using the Fibonacci Levels. I have plotted the Fibonacci Levels from the high to the low price of 2014.10.12 candlestick. Of course the long trade setup was reported when the next candlestick (2014.10.19) which is the confirmation candlestick closed. Based on the Fibonacci Levels, the stop loss had to be placed either where the 61.80% level is which is where we set the stop loss when we reported the trade setup on 2014.10.26 (see the above chart). GBP/JPY went up strongly and it didn’t retest the 61.80% level. It strongly broke above 161.80% and 261.80% levels (#1 and #2 on the below chart), but was stopped by 423.60% level (#3). Then it went as low as 161.80% to retest this level, but it works as a support and made the price bounce up (#4). Now it has broken above the 261.80% level again:

Next week can be an important week. AUD/JPY went all the way up to retest the broken support line. This week’s candlestick closed right below the line. Most probably next week’s candlestick will tell whether AUD/JPY will go down, or it will break above the line again and will go up:

Will AUD/JPY reach the 161.80% level?

GBP/CAD has formed a Bearish Engulfing Pattern by 2015.02.24 candlestick. It is a short trade setup, but not a too strong and 100 score one. There are some negative points with it:
- The uptrend is too strong on the daily chart. This is the most important negative point. It is risky to go short against such a bullish market.
- 2015.02.24 candlestick Bollinger Upper Band breakout is not bad, but the engulfing is not that strong itself.

2015.02.24 candlestick has formed a too strong Bearish Engulfing Pattern on the daily chart. Although the engulfing is too strong itself, but there is a weak Bollinger Upper Band breakout, and bulls still look strong. Therefore, this is a 90-95 score short trade setup.

USD/CAD is forming a Bollinger Bands Squeeze on the daily chart. It is just the beginning. It can become much longer than this, but it can be broken very soon too:

AUD/USD has been going down strongly during the past several months. It has formed a too strong downtrend. It has already formed a small Bollinger Bands Squeeze that was broken by yesterday’s candlestick. However, today’s candlestick has formed a too strong bearish body and so a too strong Bearish Engulfing Pattern:

Now the question is whether this is a too strong short trade setup or not?
It is a too strong Bearish Engulfing Pattern formed on a downtrend. So, it is a good continuation trade setup. The problem is it has already touched Bollinger Middle Band and it seems it is reacting to it as a support. I prefer not to take it. If it goes down after this candlestick, then I miss the movement. If it goes up, chances are it forms another too strong short trade setup with a better conditions.

We were right about the negative points of NZD/CAD short trade setup formed by 2015.02.24 daily candlestick. However, from today’s candlestick, you can say that it is possible that if forms another short trade setup soon. It is strongly possible that the next candlestick becomes bearish. You can say this from today’s candlestick upper shadow. Let’s see.
I will have to adjust the Fibonacci levels later.

How To Draw Fibonacci Retracements
This is a tutorial on how to draw fibonacci retracement using the metatrader4 forex trading platform. Knowing how to use fibonacci in forex trading is one simple trading skill every forex trading should know about.
One of the first things you should know about fibonacci retracement tool is that it is not a forex indicator. It is just a tool to measure potential price retracement levels. You should also know that the fibonacci retracement tool works best in a trending market.
If you are using metatrader4 chart for forex trading, this is what the fibonacci retracement tool icon looks like and you will find it at the top of your mt4 trading plaftorm when you open it:

HERE’S HOW THE FIBONACCI RETRACEMENT TOOL WORKS
Well the next section below will make this very easy for you to understand.
HOW TO DRAW FIBONACCI RETRACEMENT LEVELS
Here are only 2 simple rules on how to draw a fibonacci retracement but before you do that, first, you need to find out if the market is in an uptrend or downtrend . Then find out the price level where the uptrend or downtrend started. In simple terms, find out the “start” of that uptrend or downtrend. Next thing find out the price level where the advance ended.

WHAT ARE THE BEST FIBONACCI RETRACEMENT LEVELS TO USE?
For me personally, I focus only on 3 levels.
FIBONACCI TRADING
For some reason or reasons, the forex market generally tends to react around fibonacci retracement levels. As can be seen in the chart above where price fell to around 38.2 fibonacci level and went back up all the way breaking the resistance level at point 3.
So how do you apply this knowledge of fibonacci retracement levels to your trading?
Well, here’s a couple of trading ideas and techniques which you can explore:
One of the first things you should know about fibonacci retracement tool is that it is not a forex indicator. It is just a tool to measure potential price retracement levels. You should also know that the fibonacci retracement tool works best in a trending market.
If you are using metatrader4 chart for forex trading, this is what the fibonacci retracement tool icon looks like and you will find it at the top of your mt4 trading plaftorm when you open it:
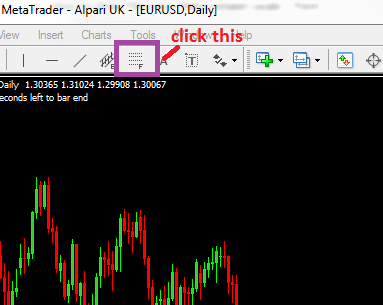
HERE’S HOW THE FIBONACCI RETRACEMENT TOOL WORKS
- when the forex market is in an uptrend (going up), as some stages along its upward movement, price will fall back down where it will find support and then bounce back up
- or when the forex market is in a downtrend (going down), at some stage, its downward movement will stop and price will rise up where it will find resistance and then fall back down.
- with fibonacci trading, you are looking for the opportunity to get into trades on these fibonacci retracement levels where price either bounces back up(in an uptrend situation) when it hits the support level which may correspond to a fibonacci support level
- or in a downtrend market, you are using the fibonacci retracement tool to get into a trade(s) at fibonacci retracement levels where it hits resistance levels (and these resistance levels correspond to the the fibonacci level)
Well the next section below will make this very easy for you to understand.
HOW TO DRAW FIBONACCI RETRACEMENT LEVELS
Here are only 2 simple rules on how to draw a fibonacci retracement but before you do that, first, you need to find out if the market is in an uptrend or downtrend . Then find out the price level where the uptrend or downtrend started. In simple terms, find out the “start” of that uptrend or downtrend. Next thing find out the price level where the advance ended.
- Then click and activate the fibonacci tool on your mt4 trading platform
- and click at the start of where the trend started and drag it to where the market advance has ended. (You must click and drag).
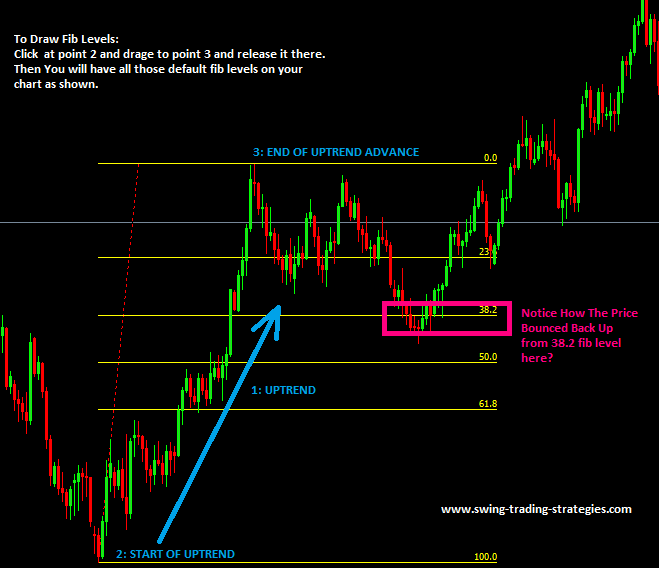
WHAT ARE THE BEST FIBONACCI RETRACEMENT LEVELS TO USE?
For me personally, I focus only on 3 levels.
- 38.2
- 50 &
- 61.8 fib levels.
FIBONACCI TRADING
For some reason or reasons, the forex market generally tends to react around fibonacci retracement levels. As can be seen in the chart above where price fell to around 38.2 fibonacci level and went back up all the way breaking the resistance level at point 3.
So how do you apply this knowledge of fibonacci retracement levels to your trading?
Well, here’s a couple of trading ideas and techniques which you can explore:
- combine fibonacci with other forex trading strategies and systems as a form of entry confirmation. A few examples of a forex trading systems which you can combine with fibonacci trading are: floor traders trading method & trendline trading strategy (check them out)
- or you can try just being a 100% fibonacci retracement trader and take your trades entries based on fib levels you draw. Personally, I think(my opinion ok…haven’t tried anything on that yet..?) it would no be really good. But if you can combine fib trading with reversal candlestick patterns (as I’ve mentioned above), this would work out well for you I believe.
How to Implement Fibonacci Analysis in Forex Trading?
So we have now seen how the Fibonacci numbers relate to the natural world and human perception. But how can we apply Fibonacci in Forex trading and how can we improve our analysis with Fibonacci ratios?Imagine the price of a Forex pair is trending upwards as a result of the bulls dominating over the bears. Then suddenly, the bears overtake the bulls and the price direction reverses. The price starts dropping against the previous trend, but for how long? This is where the Fibonacci ratios can be applied and prove useful in our trading decisions.
When the primary trend is finished and a contrary movement occurs, it is likely that the contrary move to equal 38.2% or 61.8% of the previous trend. The reason for this is that investors tend to change their attitude after the price retracements of 38.2% or 61.8% of the general trend. As we have already said, human nature has gotten used to the Fibonacci ratios within the natural environment and so it is just a natural tendency for traders, whom are part of the natural environment, to react at these levels. Traders are likely to switch sides when the price interacts with a crucial Fibonacci level.
Now that we have a basic understanding of the Fibonacci sequence and its effects in the financial markets, we turn our focus to the various trading tools that help us find these hidden levels on a chart
Fibonacci Retracements
This is the most famous Fibonacci tool and is available on nearly every Forex trading platform. It consists of a line, which is used to locate the Basic trend. With manually adjusting the line on the trend line, the Fibonacci levels are being automatically drawn on the price chart. When you settle on your Fibonacci Retracement instrument on the chart you will get horizontal lines, which indicate the levels 0.00, 23.6, 38.2, 50.0, 61.8, and 100. Once we get our Fibonacci Retracement levels, we can start our Fibonacci analysis. Let’s take a look further to see how this would work:This is the 60 min chart of the most traded Forex pair – EUR/USD. The time frame is from– Jan 6 – 21, 2016. As you can see from the image above, we have marked the basic trend, by marking the bottom to the top of the trend. This is what we would use to calculate the Fibonacci retracement ratios. The horizontal lines mark the Fibonacci percentages based on the Fibonacci sequence.
Let’s see how the price reacts to the Fibonacci levels on this chart:
- After the end of the bullish trend, the price drops and finds support at the 61.8% fib retracement level.
- After rebounding to the trend’s top, the EUR/USD drops to test the 38.2% retracement level. Notice that the price tests this level about three times.
- Then we get a slight increase to 23.6%. The price tests the level and drops again.
- The following drop reaches 61.8%. This level gets tested couple of times. Then we get another increase to 100%.
- Then another price drop to test the 38.2% level.
- Later on, we see another bounce from our 38.2% fib retracement area.
- The first green circle shows the first bounce off the price from the 61.8% level.
- Go long when the price touches that level and bounces in bullish direction.
- In this position, the close signal comes when the price hits 0.00%.
- This long position could have generated profit equal to 136 pips.
- The next long position should come in the second circle when the price bounces from 38.2%
- Unfortunately, one of the last candlewicks during the bounce hits the stop loss order.
- This position would have generated a loss of 10 pips.
- The third long position could come right after the decrease to 61.8% in the third green circle.
- An increase comes and when 23.6% is broken upwards, the stop should be adjusted between 23.6% and 38.2%.
- After consolidation around 23.6% the price drops and hits the stop.
- From this long position one could have made 41 bullish pips.
- In the next green circle, you see the fourth potential long position. Go long after the bounce from the 38.2% level.
- This long position leads right to the 0.00% level, which is the close signal.
- One could have made 76 bullish pips out of this long trade.
- There is even an opportunity for a fifth trade on this chart. One should go long after the bounce from 38.2% shown in the last green circle.
- Again, the close signal comes with the break through the 0.00% level.
- This potential long position equals 66 bullish pips.
Fibonacci Fan
This is another useful Fibonacci tool. It is based on the Fibonacci ratios, but it takes a different form on the chart. You draw your Fibonacci Fan the same way you do it with the Fibonacci Retracement, just identify the trend and stretch the indicator on it. The other components of the Fibonacci Fan will appear automatically. These are three diagonal lines, which vertically are distanced with 38.2%, 50.0% and 61.8% from the top of the trend. After we place our Fibonacci Fan on the chart, we observe the way the price reacts to the diagonal Fibonacci levels. The image below will make it clearer for you.This is the Daily chart of the EUR/USD for the period May 30 – Nov 3, 2010. We have identified the basic trend, where we place our Fibonacci Fan instrument. The small black arrows show the areas where the price bounces from the Fibonacci Fan levels. The red circles show where the levels get broken.
Notice the way the price interacts with the trend lines of the fib fan:
- After the end of the trend, the price drops through 38.2%.
- The price reaches 50.0 afterwards and bounces upwards.
- Then we see a test of the already broken 38.2% as a resistance and a bearish bounce from this level.
- The price breaks 50.0% afterwards and drops to the 61.8% level.
- The 61.8% level gets tested as a support three times in a row.
- After the third bounce the price jumps upwards breaking the 50.0% level.
- The increase continues and we see a break through 38.2%
- 2% level gets tested as a support afterwards.
In our case, we have no bounces from 38.2%. However, there are three bounces from 61.8%. Let’s simulate the eventual trading:
- Go long right after the first bounce from 61.8%.
- The price goes upwards and then drops again to 61.8% for a test.
- The level sustains the price and we see another price increase.
- Close the trade when the price closes a candle below 61.8% – the third bottom on that level.
- One could have made a profit of 22 pips from this trade.
- Then we can go long again when the price closes a candle above 61.8%.
- Hold the trade until there is a break in the stop loss right below the third bottom on 61.8%, or when you see the price breaking one of the fan’s levels in bearish direction.
- The price starts a strong bullish increase through 50.0% and 38.2%.
- 2% gets tested as a support afterwards.
- Stay with the trade until the price breaks 38.2% in bearish direction.
Download the short printable PDF version summarizing the key points of this lesson….Click Here to Download
Conclusion
- The Fibonacci projections come from a number sequence starting from (0, 1), where each number should be added to the previous one, which creates the next number of the sequence – 0, 1, 1, 2, 3, 5, 8, 13, 21, 34, 55, etc.
- The relation between these numbers generates the basic Fibonacci Ratios – 61.8% and 38.2%.
- These ratios are found all around us in the natural universe,
- Since people constantly see Fibonacci ratios subconsciously, human nature has been adapted to perceive this as a harmonic ratio.
- The Fibonacci Ratio is present in the financial markets, since the markets are really just a reflection of human emotions.
- When the price reverses a trend, the reversal intensity is likely to start hesitating or even stop around 38.2% or 61.8% the size of the previous trend.
- Some of the Fibonacci trading tools to measure these ratios on-chart are the Fibonacci Retracements and the Fibonacci Fan.
- Fibonacci Ratio tools should be used in conjunction with other technical analysis methods and when technical confluence is present around these levels, then there exists a possibility of a high probability trade setup.
3 comments